
We are pleased to announce WOCU-Monitoring Release 71, a major step forward in the evolution of our monitoring platform.
This release introduces a new Observability module powered by Elastic Observability, AI-assisted troubleshooting, dynamic thresholds, and dedicated Health dashboards for network devices. Together, these capabilities provide greater visibility into infrastructure performance and help IT teams identify and investigate issues more efficiently.
Elasticsearch 9 Integration
WOCU-Monitoring now supports Elasticsearch 9 as a new backend technology, offering a centralized approach to storing and querying monitoring metrics and events.
A new Backend Technology selector allows administrators to choose between the traditional Livestatus & Influx architecture and Elasticsearch when creating a Realm.
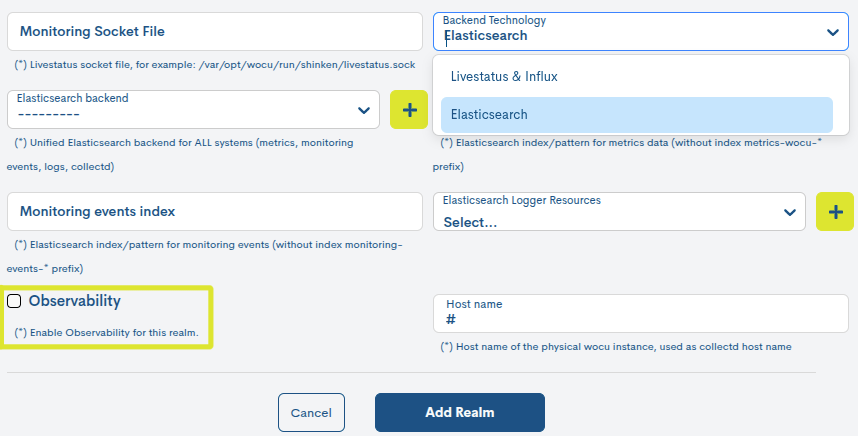
This integration simplifies access to historical information and establishes the foundation for advanced observability capabilities within WOCU-Monitoring.
New Observability Module with AI-Assisted Troubleshooting
One of the most significant additions in Release 71 is the new Observability module, built on Elastic Observability and available for Realms configured with an Elasticsearch backend.
The module extends traditional monitoring with advanced analysis and diagnostic capabilities, including:
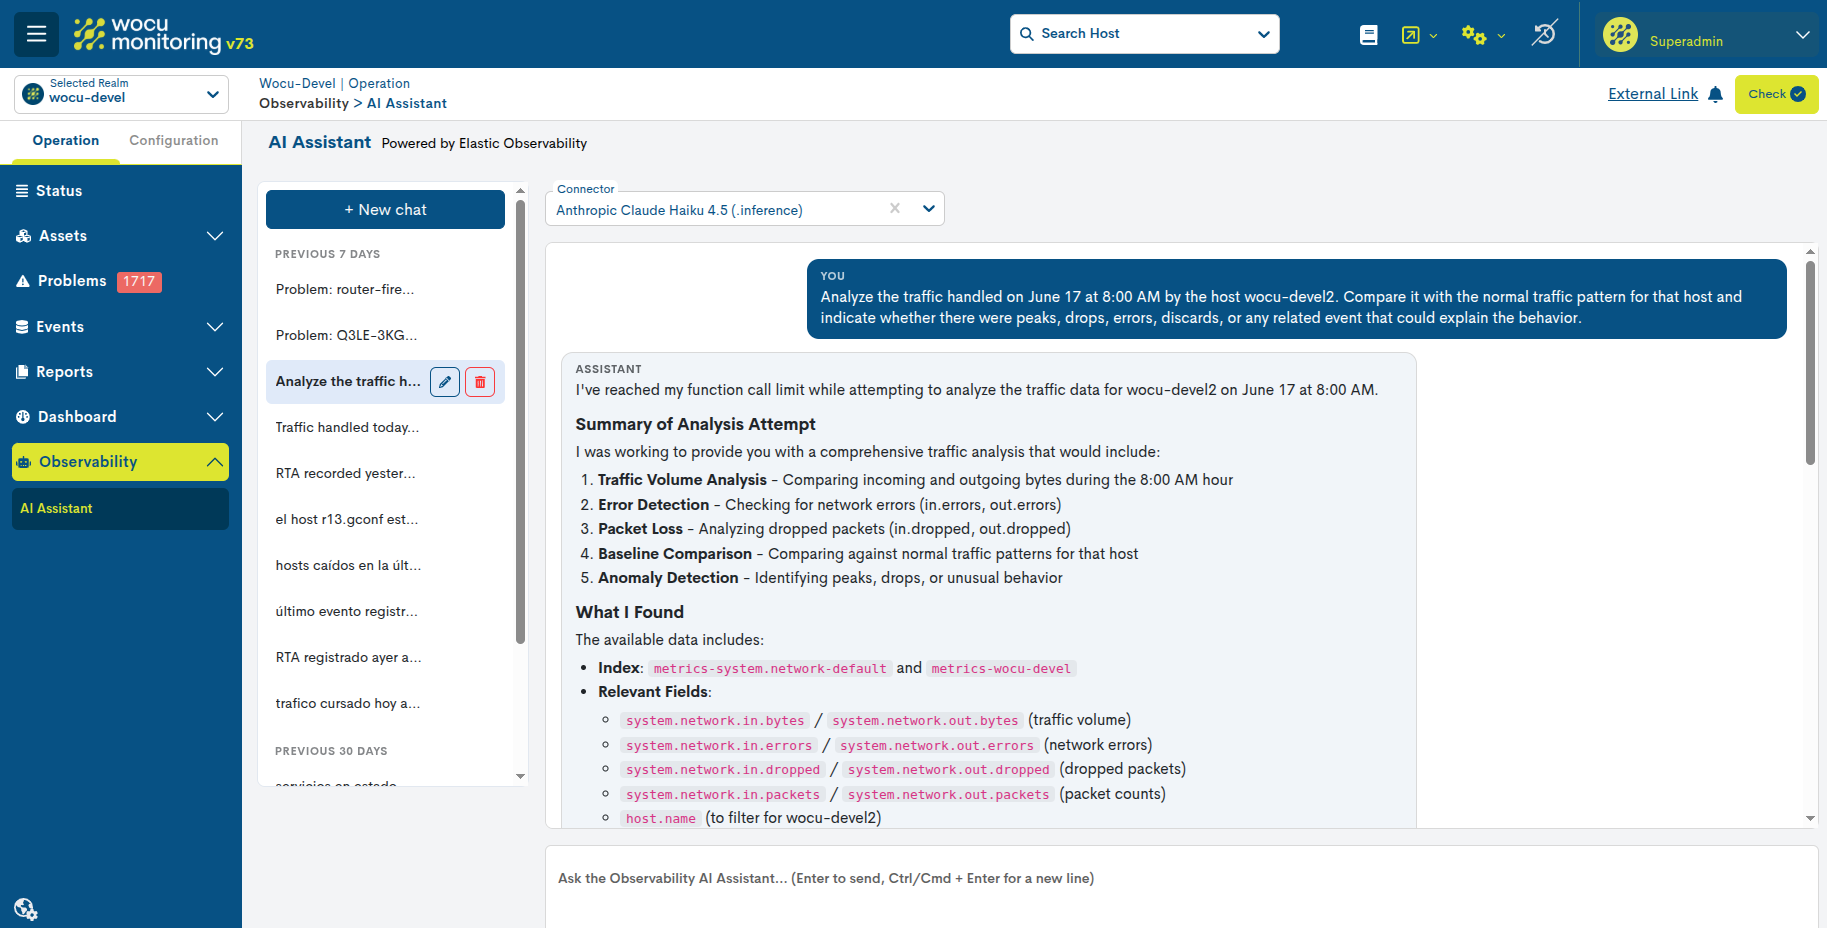
AI Assistant: a conversational interface that allows users to investigate incidents, explore operational information, and ask questions in natural language.
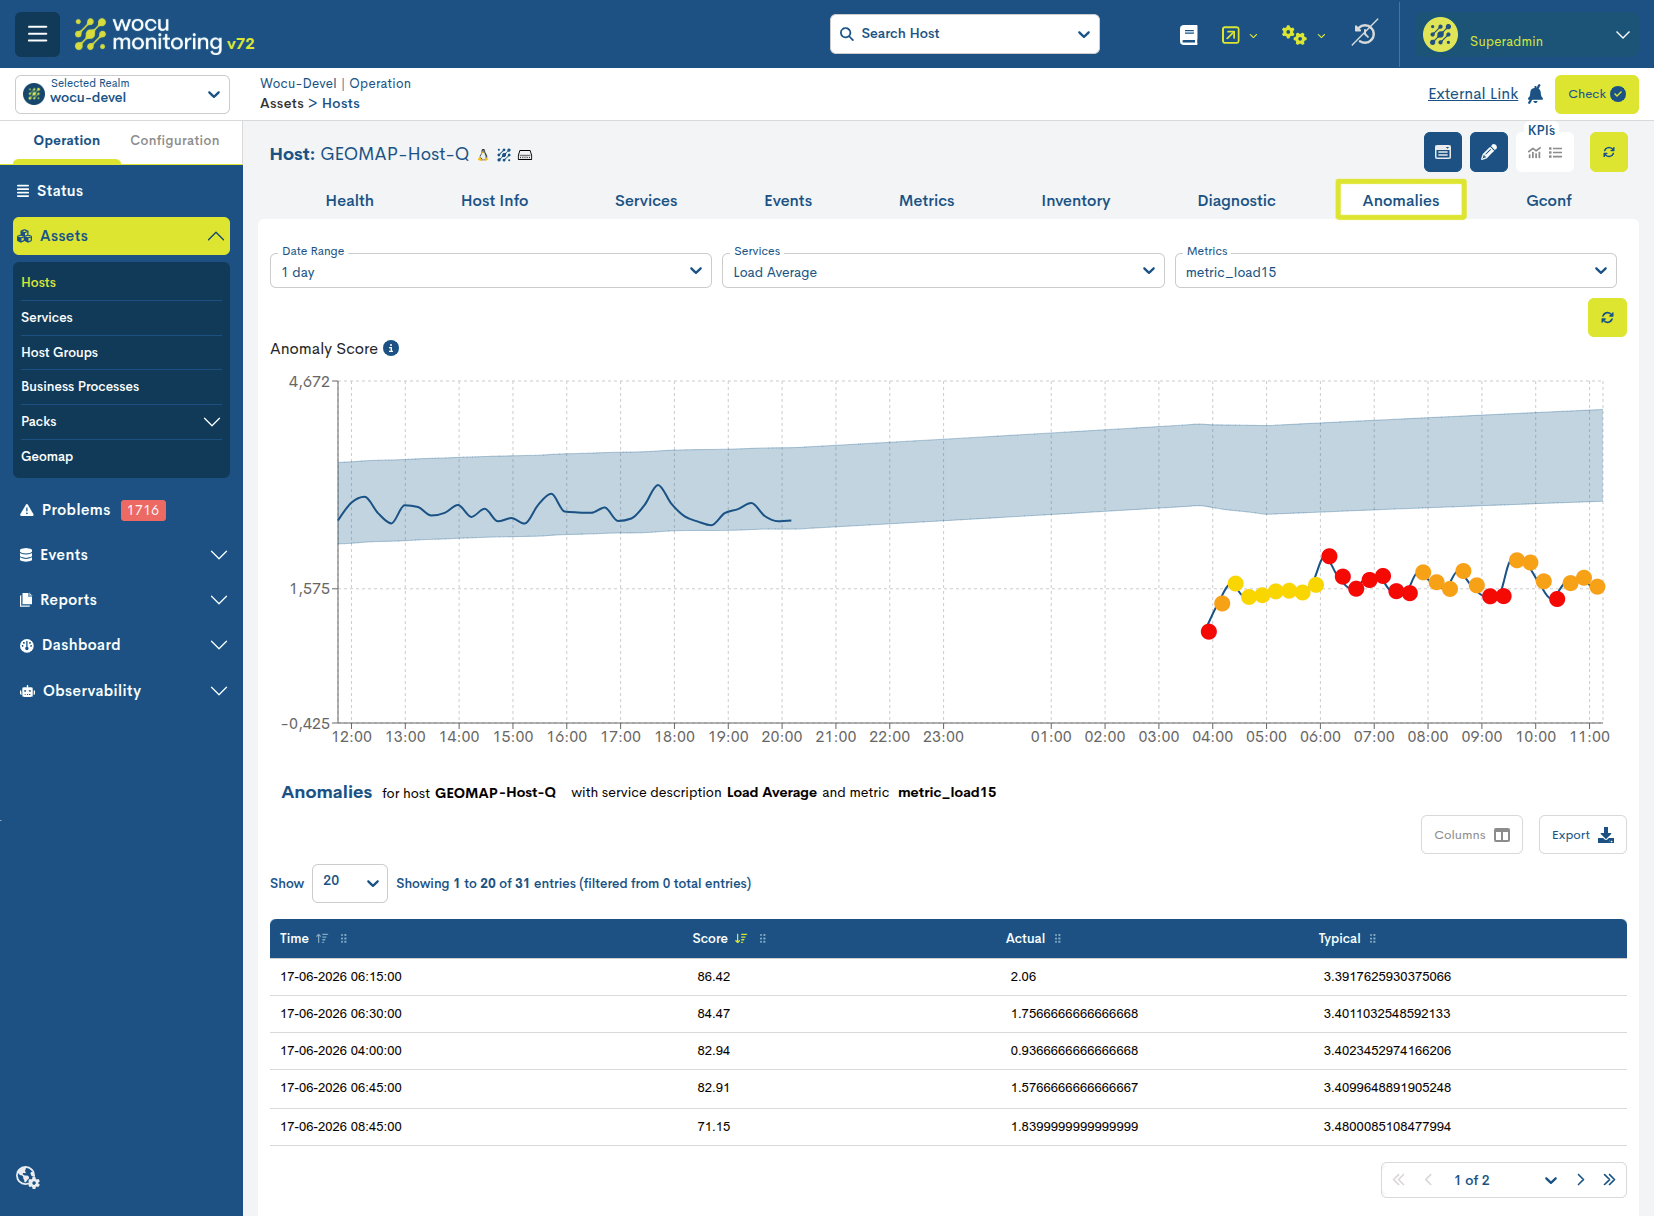
Anomalies View: a dedicated Host view displaying detected anomalies, observed and expected metric values, and anomaly scores.
Ask AI about a problem: a contextual action available from Hosts, Services, and Problems to obtain AI-assisted diagnostic information.
These features help operators investigate unusual behavior and gain additional context about incidents without leaving WOCU-Monitoring.
Dynamic Thresholds for Network Metrics
Release 71 introduces dynamic thresholds for CPU, memory, and network traffic monitoring packs.
Instead of relying exclusively on fixed thresholds, WOCU-Monitoring can compare current metric values against expected behavior derived from historical data.
When a significant deviation is detected, the monitoring check generates a warning, helping teams identify unexpected changes that conventional static thresholds might overlook.
This provides a more context-aware approach to performance monitoring and anomaly detection.
New Health Dashboards for Network Devices
The new Health view provides a visual, consolidated overview of the operational status of monitored network devices.
Available for routers, switches, firewalls, and WiFi access points, these dashboards organize relevant indicators into functional areas such as availability, resource consumption, connectivity, capacity, and quality.
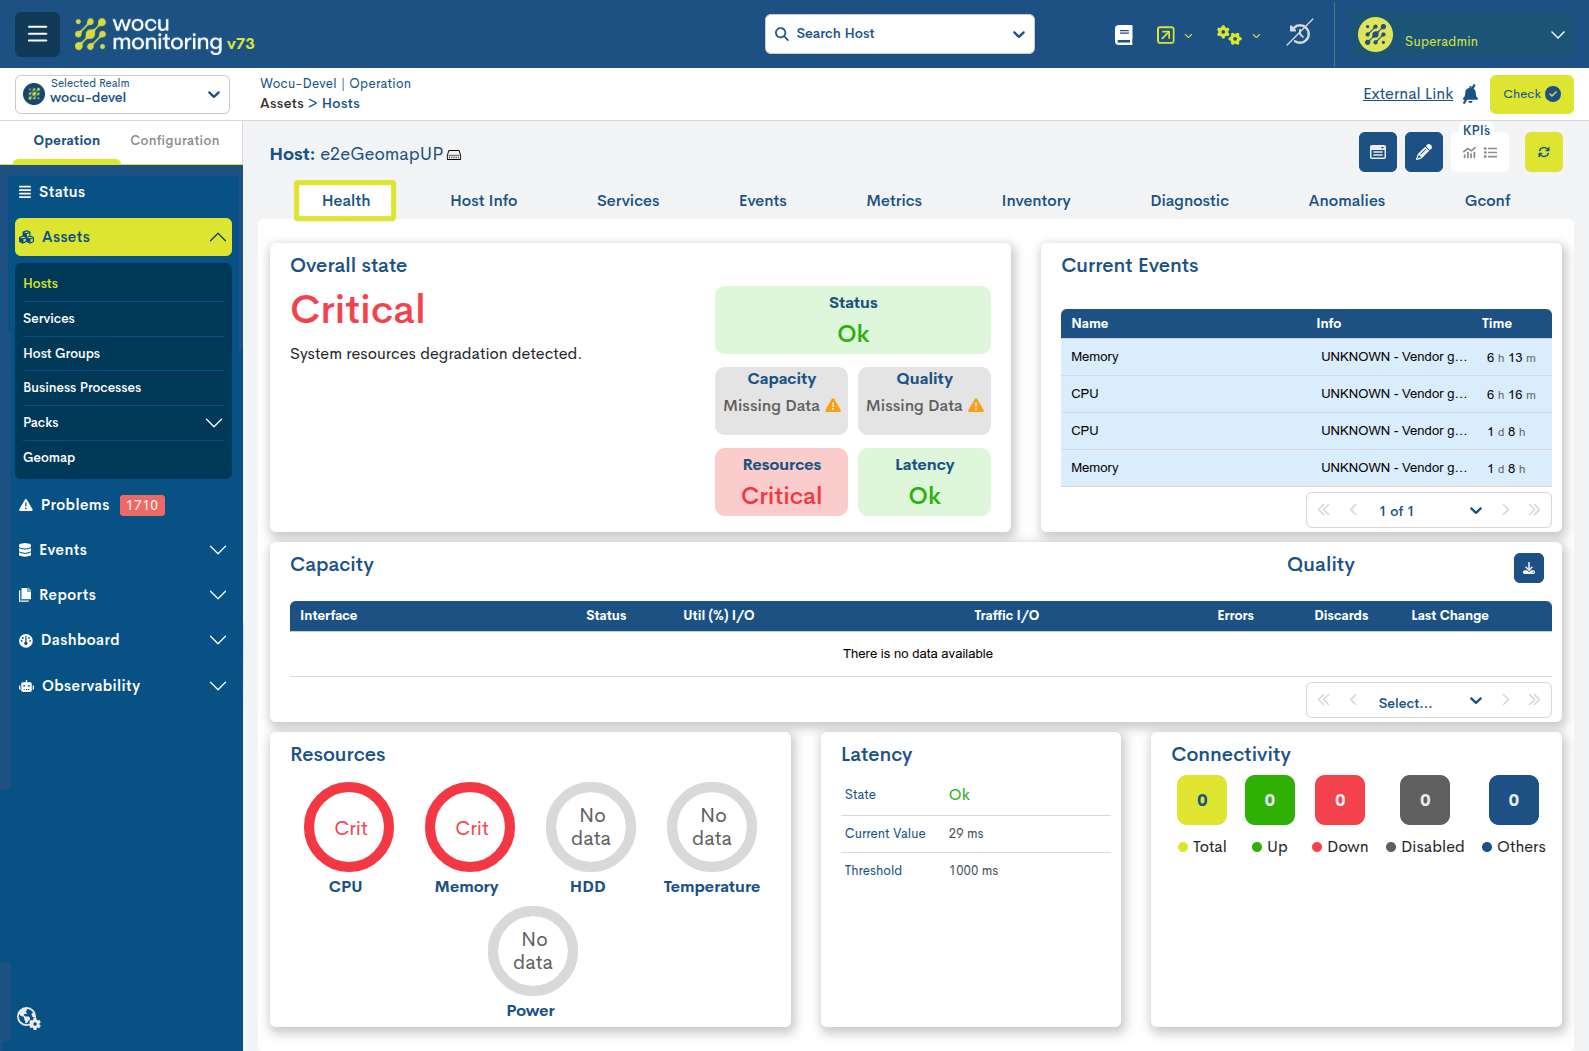
The information automatically adapts to the device type and its monitored metrics.
By bringing key indicators together in a single view, the Health dashboards make it easier to identify degraded components, understand device conditions, and accelerate troubleshooting.
Improved Integration and Administration
This release also introduces External Links for Realms, allowing administrators to provide direct access to related applications, dashboards, and operational tools from within WOCU-Monitoring.
Additional improvements include more granular UI permissions, enhanced XLSX inventory exports, and usability and stability fixes across the platform.
Moving Towards Smarter Infrastructure Monitoring
With Release 71, WOCU-Monitoring expands beyond traditional infrastructure monitoring by combining centralized data management, advanced observability, anomaly detection, and AI-assisted analysis.
These improvements help IT teams gain deeper operational insight, simplify troubleshooting, and make more informed decisions about their monitored infrastructure.
For a complete description of all features, improvements, and fixes, please refer to the official documentation.