
We are pleased to announce WOCU-Monitoring Release 75, a major update introducing new capabilities for IoT monitoring, AI-assisted troubleshooting, event correlation, and Observability management.
This release expands the platform’s monitoring capabilities with MQTT integration, Root Cause Analysis (RCA), enhanced predictive dashboards, and new tools for managing data ingestion and AI consumption. It also introduces improvements to notifications, monitoring performance, and operational workflows.
1. New MQTT Integration for IoT Monitoring
Release 75 introduces MQTT integration, extending WOCU-Monitoring’s capabilities to IoT devices and other systems that publish monitoring data through MQTT brokers.
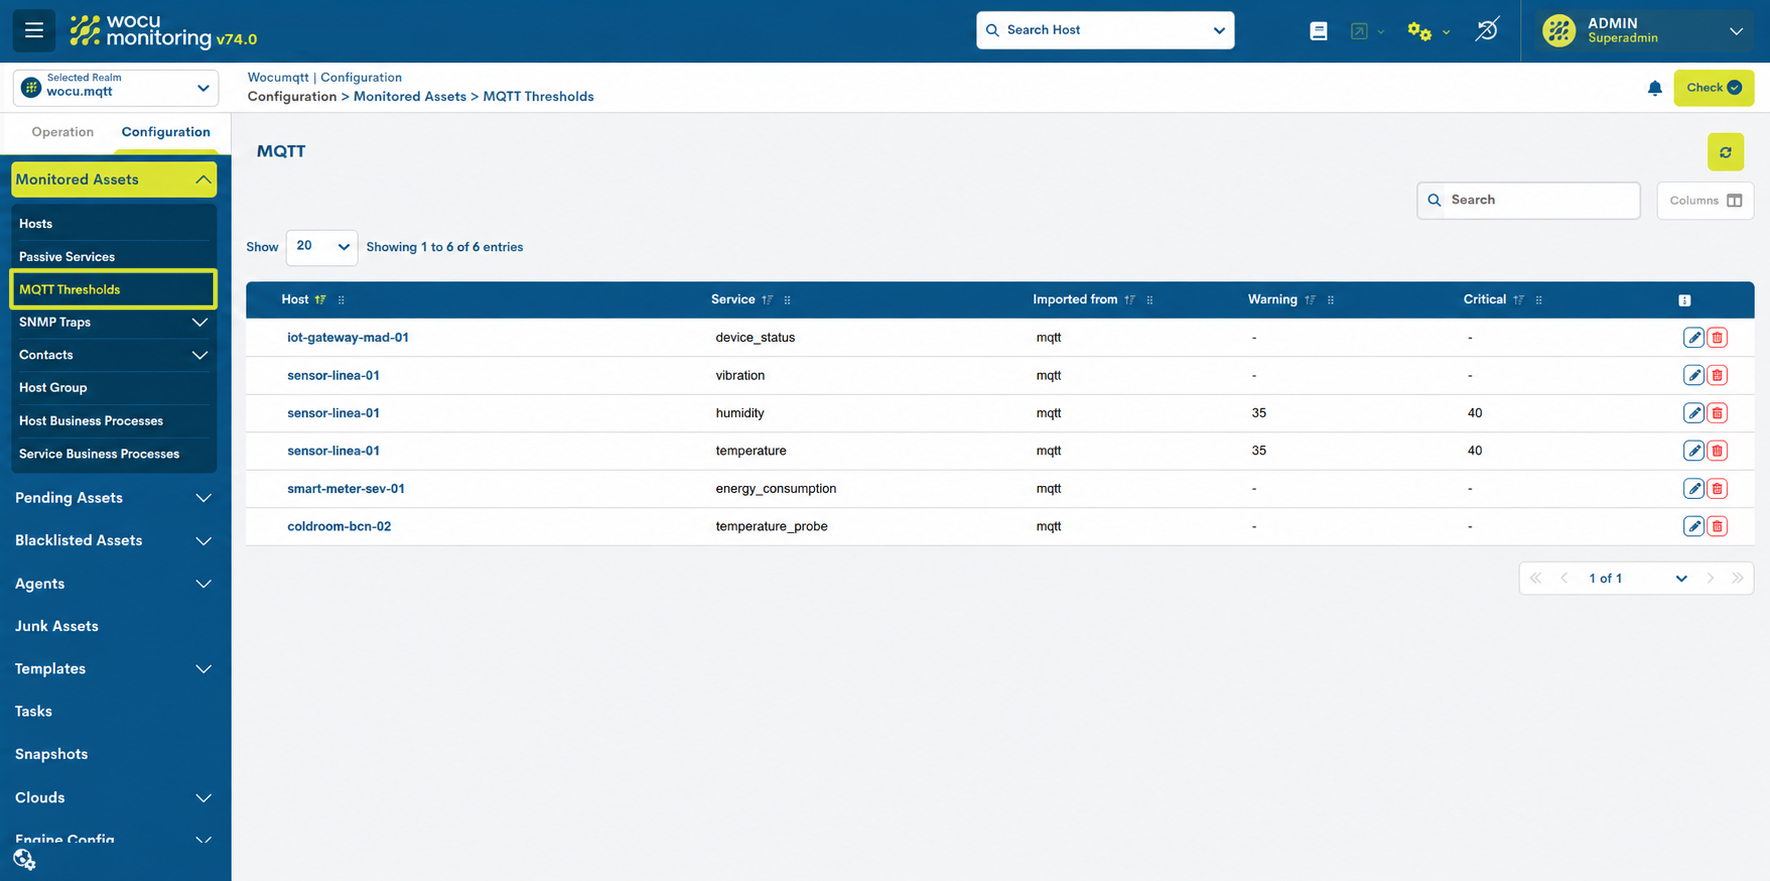
Unlike traditional active monitoring, devices can send their metrics and status information directly to an MQTT broker. WOCU-Monitoring consumes this information and automatically creates the corresponding passive monitoring services.
The new MQTT Thresholds view allows administrators to configure Warning and Critical thresholds for these services, integrating them into the platform’s standard monitoring and alerting workflows.
This provides a flexible way to monitor IoT environments without requiring a dedicated monitoring pack for each device type.
2. AI-Powered Root Cause Analysis and Enhanced AI Assistant
One of the most significant new features is the Root Cause Analysis (RCA) action, available directly from Hosts and Services.
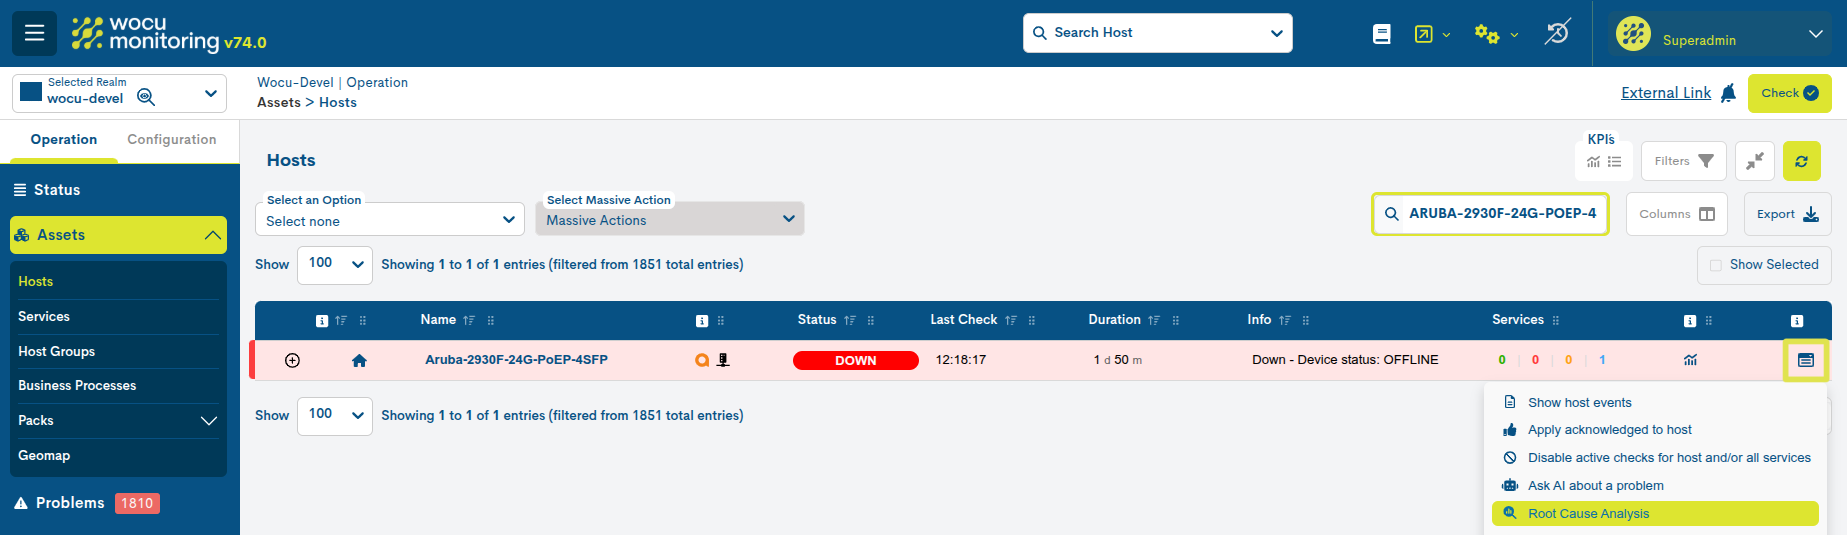
Powered by the WOCU-Monitoring AI Assistant, this functionality correlates information from multiple observability sources, including metrics, monitoring events, syslogs, and SNMP traps, to help identify the most likely cause of an incident.
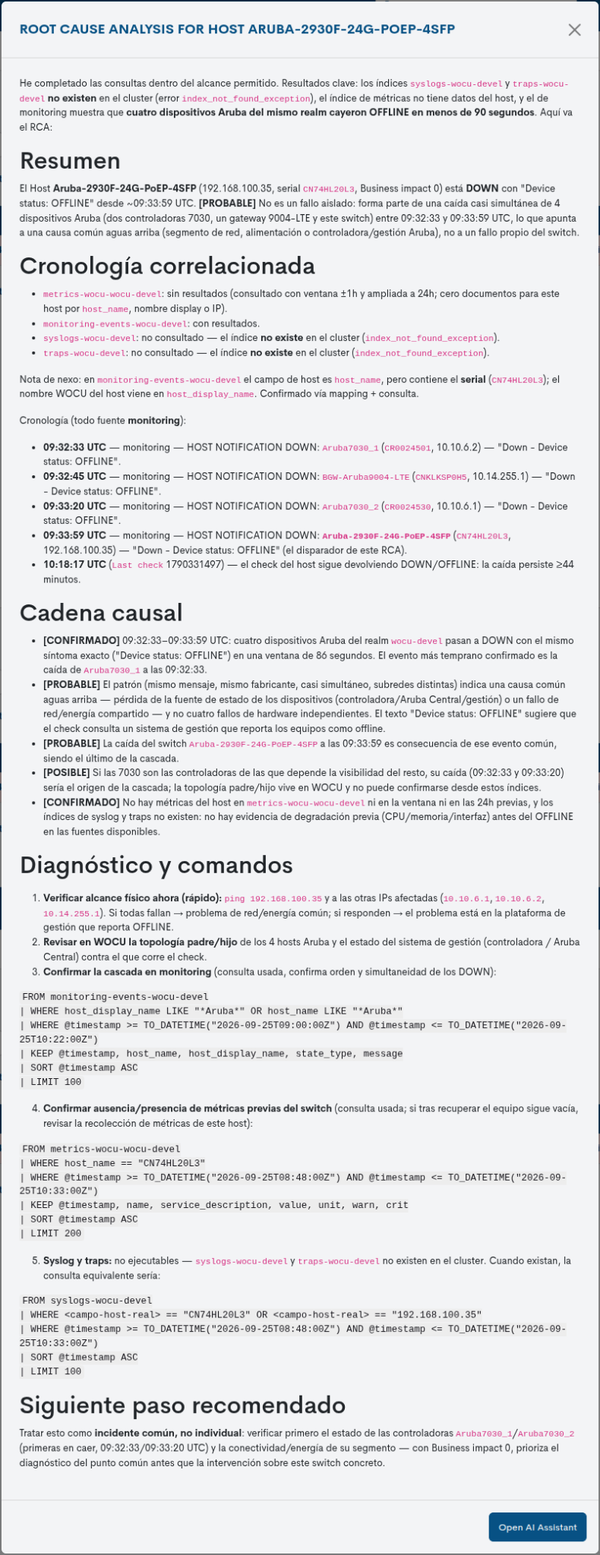 The analysis can provide an incident summary, a timeline of related events, possible causal relationships, and recommended investigation steps. Users can also continue their investigation through the AI Assistant.
In addition, the AI Assistant now integrates with Elastic Agent Builder, providing a new conversational experience based on each Realm’s observability context.
Release 75 also introduces AI usage monitoring and quota management, allowing administrators to track token consumption, configure limits by Realm and user, and gain visibility into associated costs.
These capabilities provide more powerful diagnostic tools while improving control over AI resource consumption.
3. Smarter Event Correlation
Event correlation becomes more flexible with two important enhancements.
The new Tag Aggregation rule dynamically groups monitored devices according to matching tag patterns and evaluates correlation conditions independently for each group.
This simplifies the management of distributed infrastructures, reducing the need to create separate correlation rules for every location, customer, or device category.
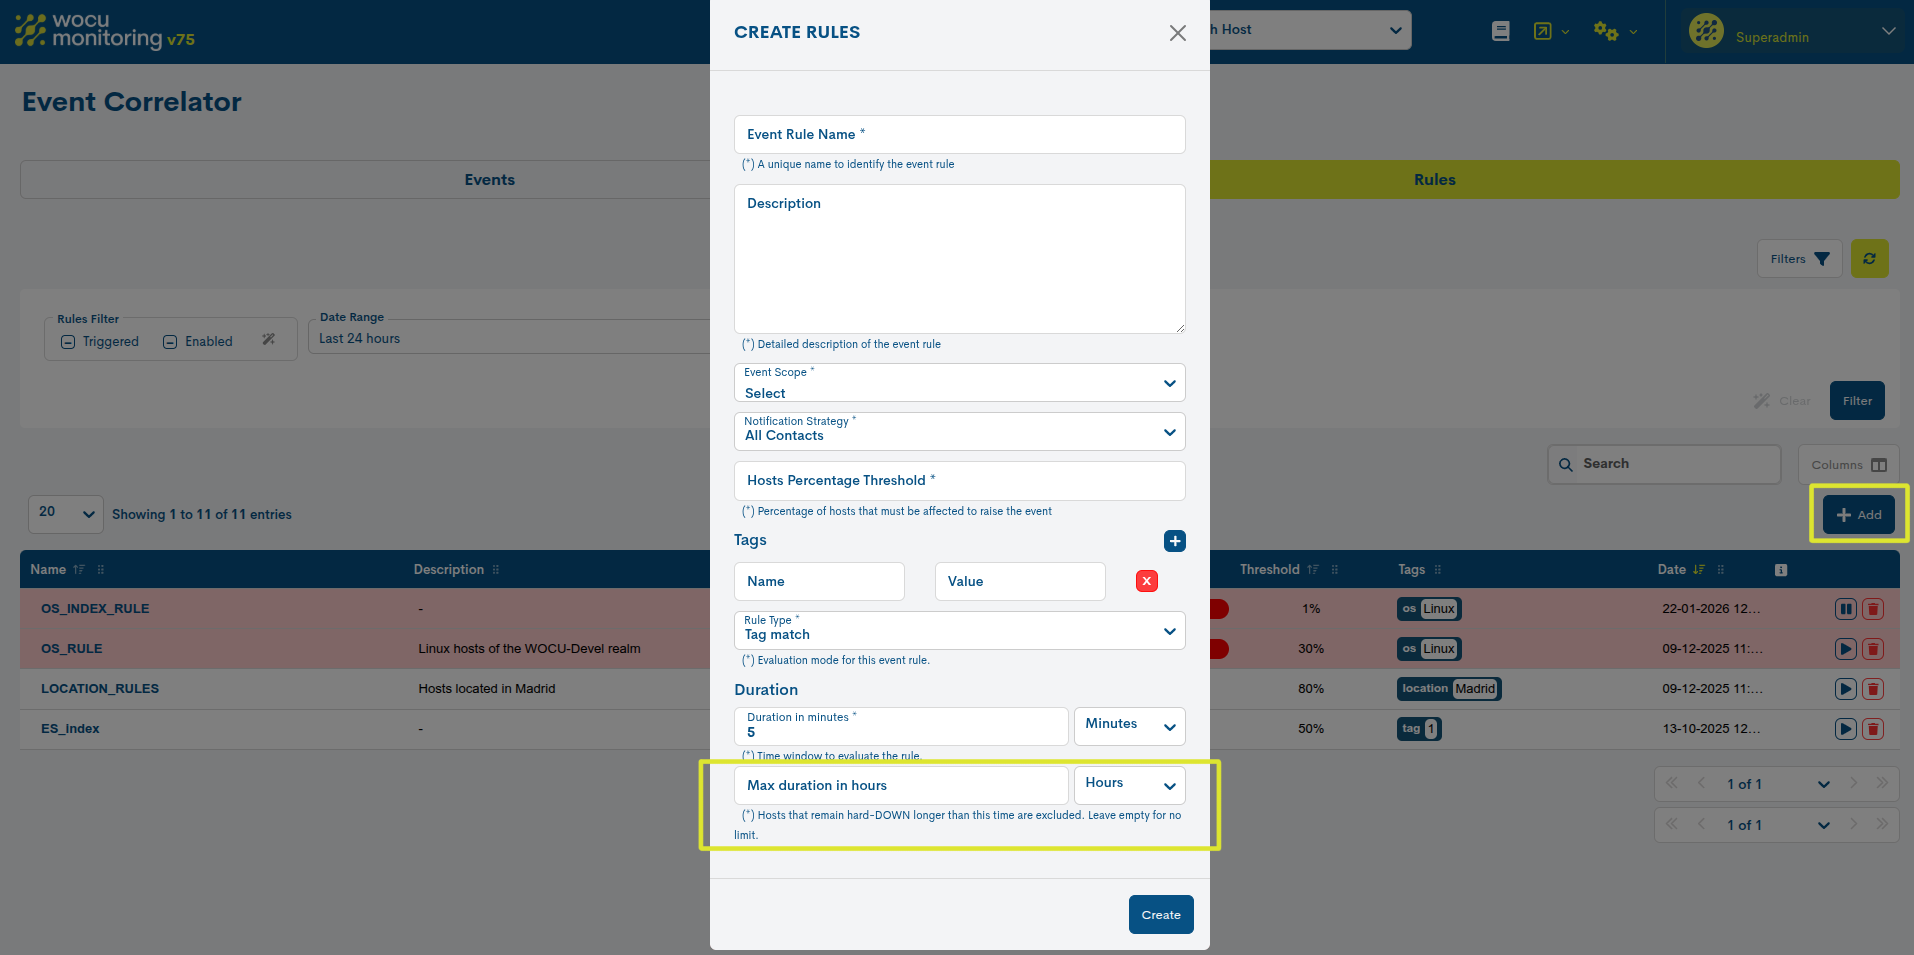
Additionally, a new maximum DOWN duration parameter allows administrators to define how long a device remains relevant to a correlation rule, improving the precision of event analysis.
Together, these improvements help monitoring teams identify related incidents more effectively and reduce unnecessary operational noise.
4. Enhanced Predictive Dashboards and Visualization
Release 75 introduces several improvements to dashboards and predictive monitoring.
The Single Metrics Graph widget now supports Forecast, allowing users to display predicted metric values alongside historical data. Forecast information can also be included in exported PDF metric reports.
A new Host Groups by State widget provides a graphical overview of host group availability through color-coded hexagons, making it easier to identify groups experiencing connectivity or availability issues.
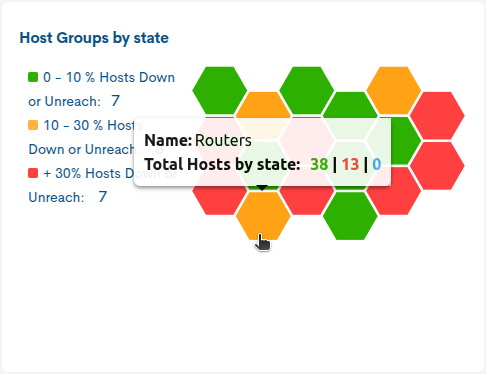
For Observability environments, a new Home dashboard consolidates host and service status, geographical information, and host group health into a single operational view.
Host group summaries also include network traffic statistics and a 24-hour traffic forecast, helping teams anticipate potential capacity requirements.
Additional enhancements include widget duplication and new Host and Service selectors for faster navigation between monitored assets.
5. New Data Ingestion Metering and Quota Management
Release 75 introduces new capabilities for monitoring and managing Observability data ingestion.
Administrators can now track daily and monthly ingestion volumes by Realm and MultiRealm, including monitoring metrics, events, and syslog data.
The new ingestion metering interface provides visibility into consumption trends, assigned quotas, available capacity, and potential quota overruns.
Monthly ingestion quotas can also be configured to reflect the capacity allocated to each environment.
These capabilities improve transparency and support capacity planning, resource allocation, and cost management across multi-tenant Observability deployments.
6. Expanded Notifications and Monitoring Integrations
WOCU-Monitoring extends its notification capabilities with two new channels: SMS and Microsoft Teams.
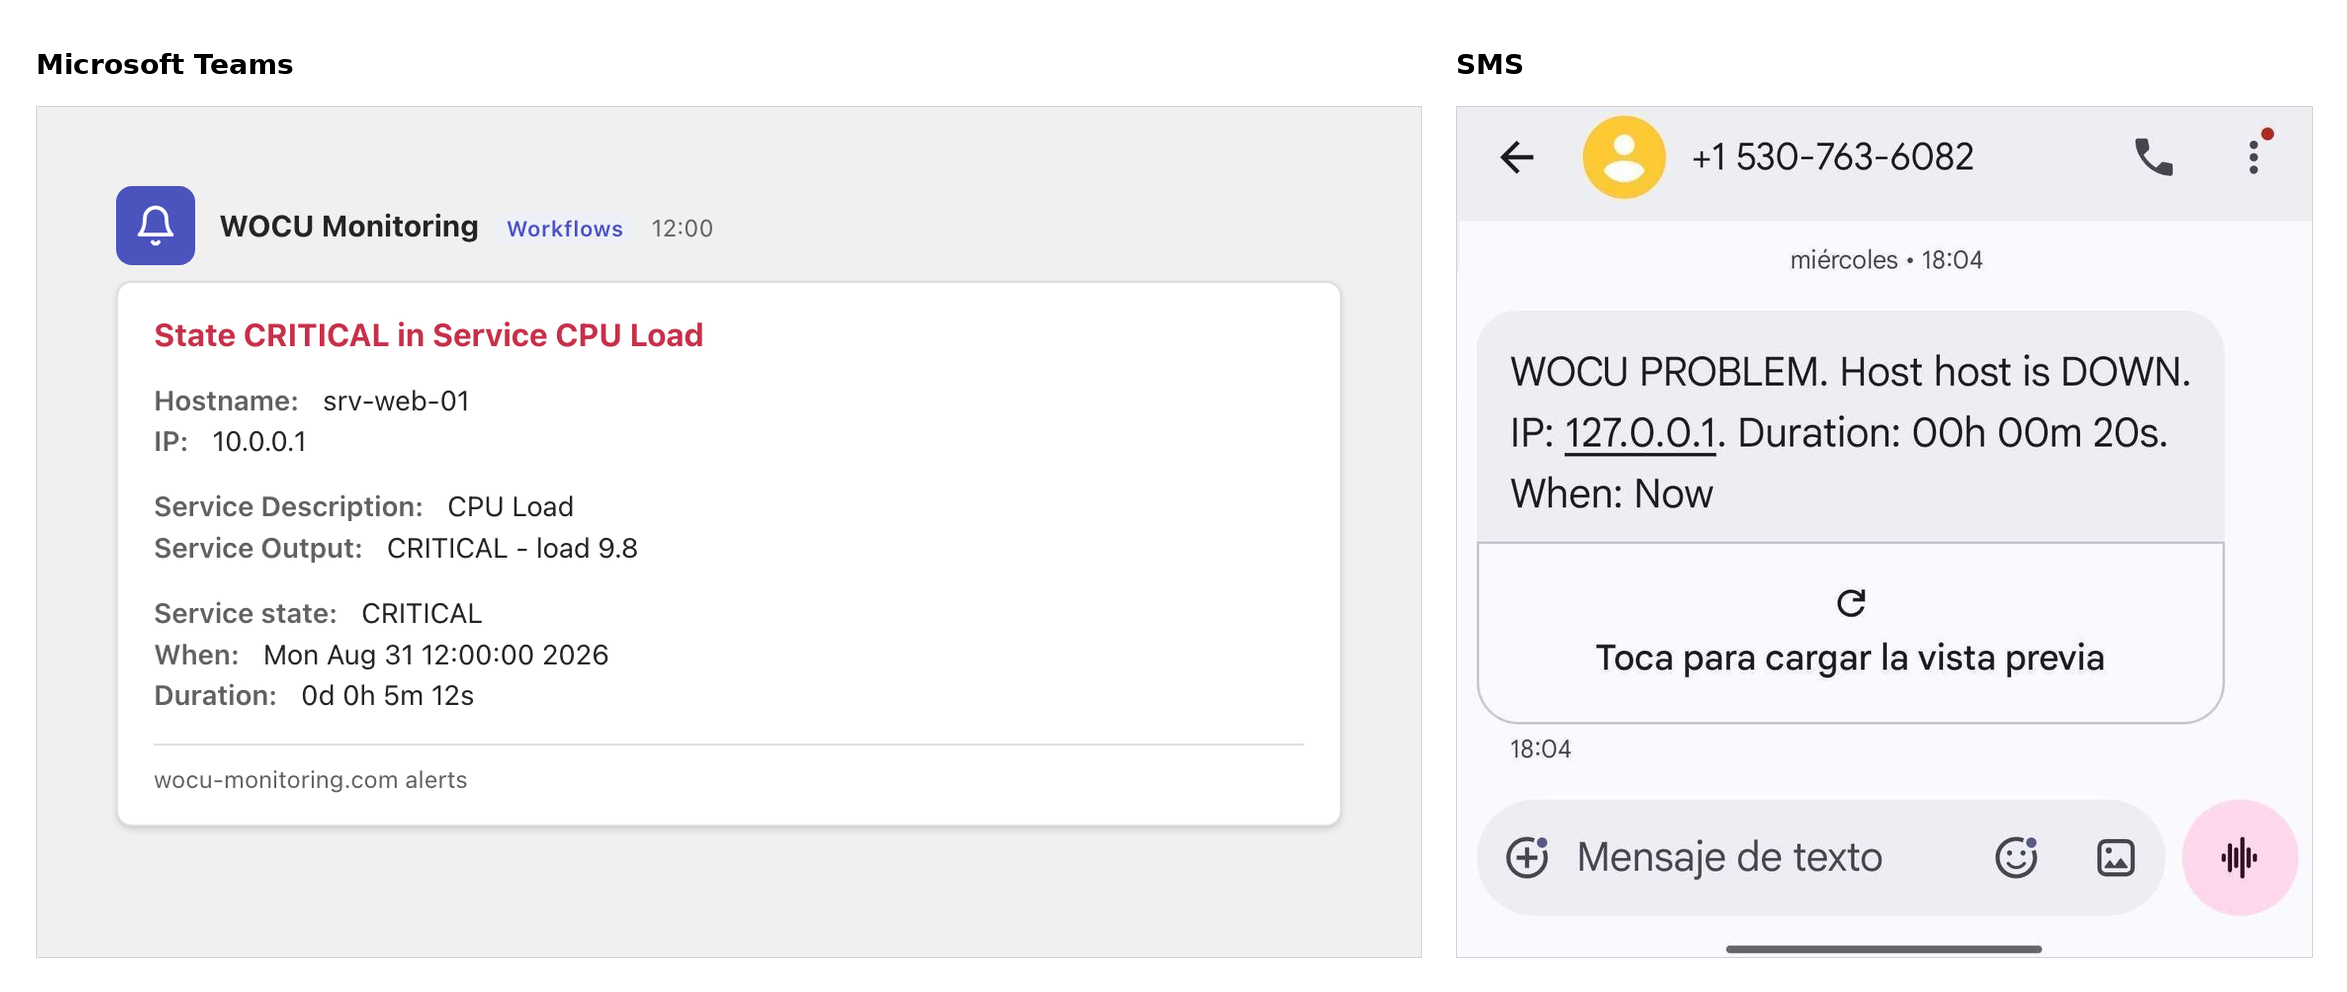
These integrations allow monitoring alerts to reach operators through mobile messages or the collaboration channels already used by their teams, supporting faster communication when incidents occur.
The release also introduces a new Elasticsearch ML monitoring pack, designed to monitor the operational status of Machine Learning jobs and their associated datafeeds.
This provides visibility into the availability and execution status of the analytical processes supporting advanced Observability capabilities.
7. Improved Monitoring Performance and Scalability
Release 75 includes important optimizations to monitoring execution.
Monitoring packs have been improved to reduce CPU consumption by optimizing dependency loading and check execution.
A new adaptive mechanism, load_throttle, also allows Pollers to adjust the number of checks requested from the Scheduler according to their current CPU load.
These improvements help distribute monitoring workloads more efficiently, reduce the risk of overload, and maintain stable performance in environments with large numbers of concurrent checks.
Advancing Intelligent and Scalable Monitoring
With Release 75, WOCU-Monitoring continues to evolve towards a more intelligent, integrated, and scalable monitoring platform.
By combining IoT integration, AI-assisted Root Cause Analysis, advanced event correlation, predictive dashboards, and consumption management, this release provides IT teams with additional tools to investigate incidents, anticipate operational needs, and maintain greater control over complex infrastructures.
For a complete description of all new features, improvements, and fixes, please refer to the official release documentation.