
We are pleased to announce WOCU-Monitoring Release 74, a new update that introduces advanced capabilities for predictive monitoring, anomaly detection, dashboard customization, and infrastructure management.
This release takes another step towards more proactive monitoring by incorporating metric forecasting, centralized anomaly analysis, new dashboard widgets, and simplified bulk configuration. It also expands API capabilities and introduces a new Docker-based deployment model.
1. Predictive Monitoring with Metrics Forecasting
One of the key highlights of Release 74 is the introduction of Metrics Forecast, a new feature that allows users to visualize the predicted evolution of monitored metrics for up to 24 hours.
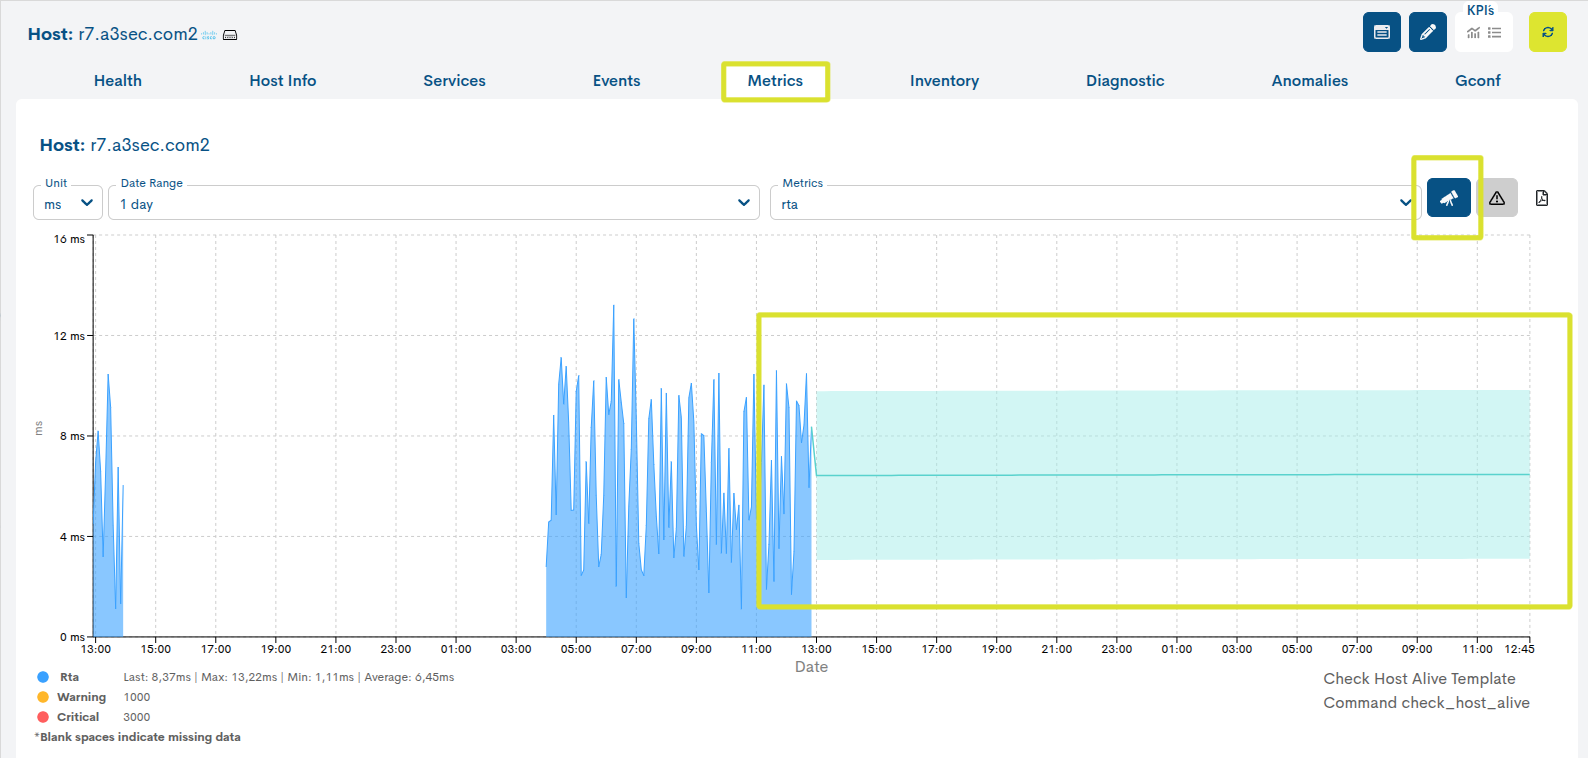
Available in the Metrics view for Realms using Elasticsearch with the Observability module enabled, this functionality displays future trends alongside historical data.
By anticipating potential changes in resource utilization, IT teams can identify metrics approaching critical thresholds and take preventive action before performance issues arise.
2. Advanced Anomaly Detection and Analysis
Release 74 significantly expands the anomaly analysis capabilities of the Observability module.
The new Anomalies view provides a centralized overview of detected anomalies across an entire Realm, allowing users to investigate unusual behavior without navigating through individual devices.
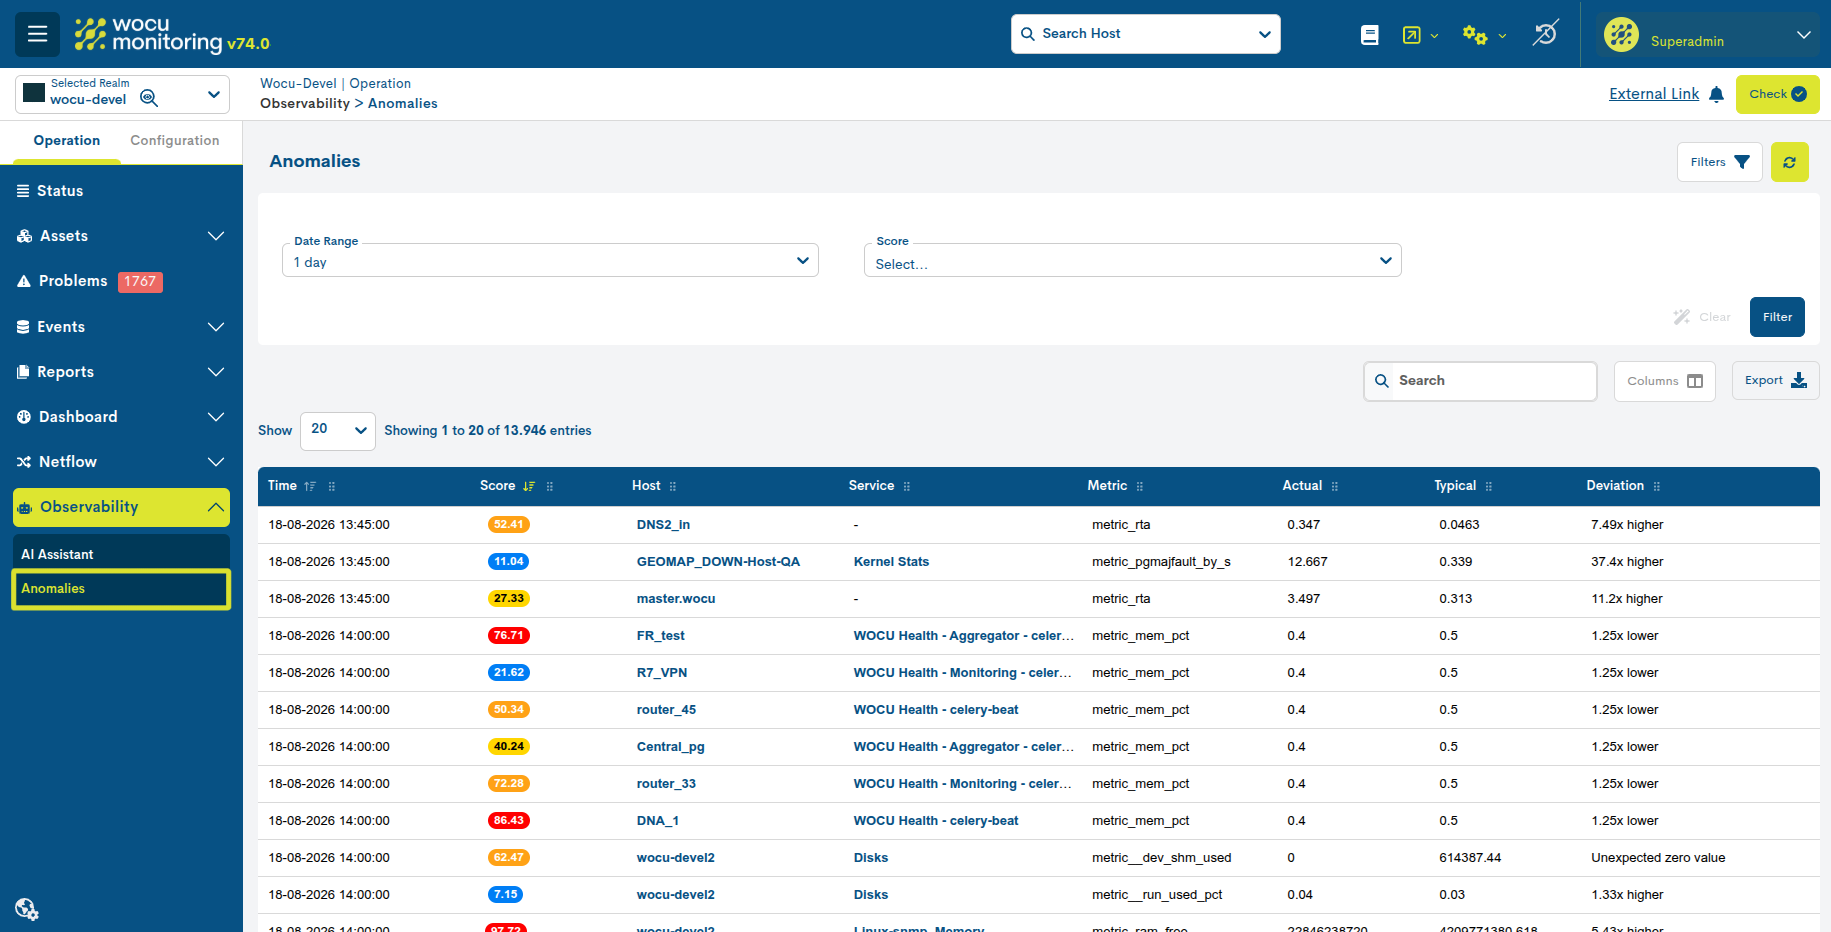
New filtering capabilities make it easier to focus on relevant anomalies based on time range and anomaly score.
The introduction of the Deviation indicator also provides additional context by showing how far a metric has moved from its expected behavior.
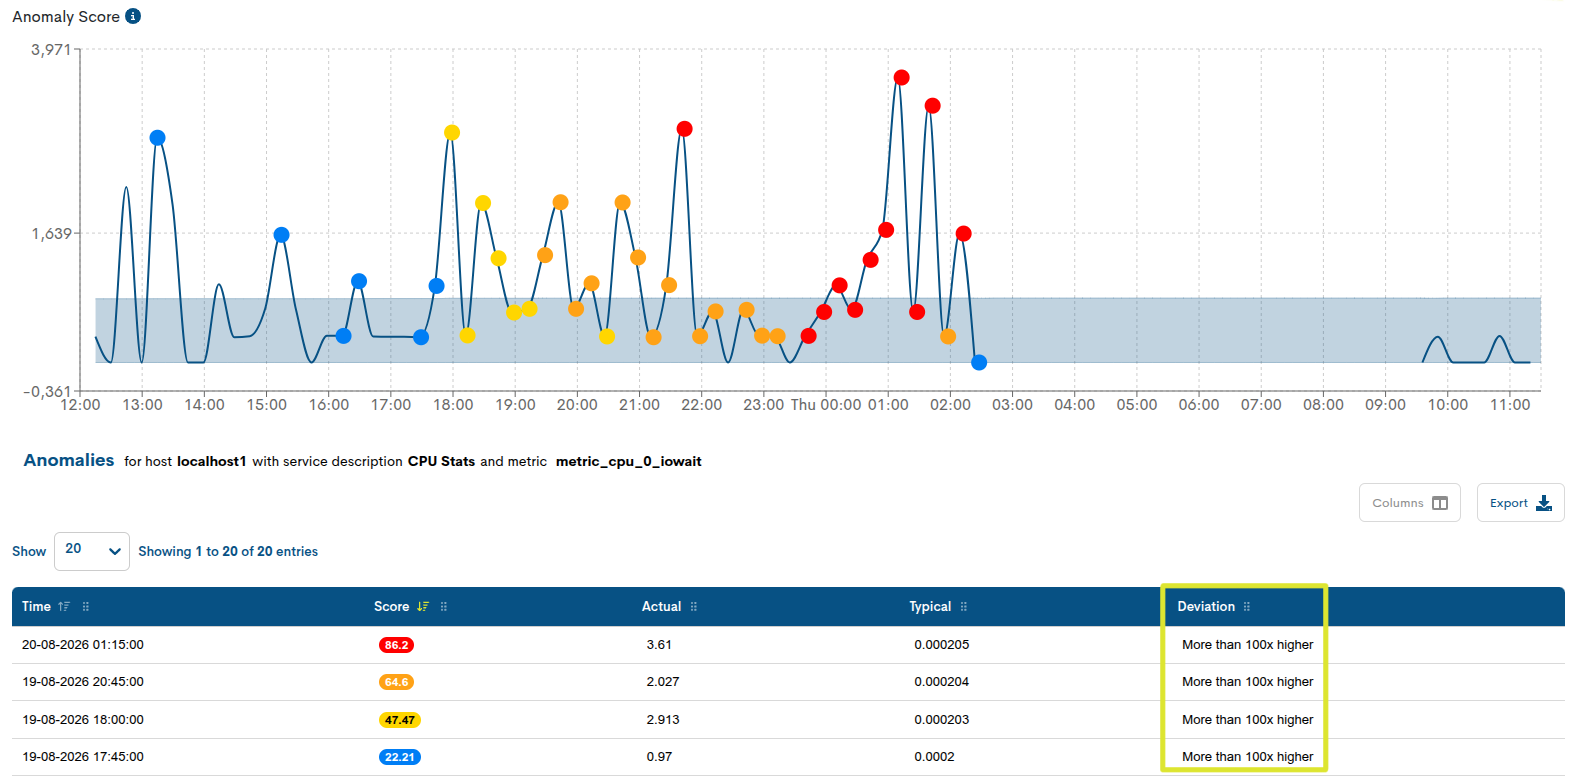
Furthermore, anomaly analysis is now available at three levels: Realm, Host, and Service.
These enhancements simplify the identification, prioritization, and investigation of abnormal infrastructure behavior.
3. More Flexible and Customizable Dashboards
The Status view now supports two new widgets: HTML and Markdown.
These components allow users to enrich monitoring dashboards with customized information such as operational procedures, technical documentation, network diagrams, links, instructions, and relevant notices.
This makes dashboards more than simple monitoring interfaces, transforming them into centralized operational workspaces tailored to each team or customer.
Additionally, the Single Metrics Graph widget introduces interactive zoom functionality, allowing operators to select specific time intervals for more detailed analysis.
4. Simplified Bulk Configuration and Notification Management
Managing large monitoring environments becomes easier with new bulk configuration options.
Administrators can now enable or disable dynamic thresholds across multiple hosts in a single operation, reducing repetitive configuration tasks.
A new bulk action also allows inventory collection to be enabled simultaneously for multiple monitored devices.
In addition, the new Disabled Notifications filter helps operators identify Hosts and Services with notifications disabled, providing better visibility into silenced assets and improving alarm management.
These improvements simplify administration and provide greater control over large infrastructures.
5. Expanded Monitoring APIs and Integrations
Release 74 introduces new API endpoints that extend access to monitoring information.
The new endpoints allow external applications to:
Discover available metrics within a Realm.
Retrieve historical metric data for specific devices and services.
Query monitoring events and state changes.
Access and filter syslog events.
These capabilities facilitate integration with external platforms, reporting tools, and automation workflows.
The public API also includes improvements to Host creation, allowing Host Groups to be assigned during device registration.
6. New Docker-Based Deployment Model
WOCU-Monitoring introduces a new Docker-based deployment model designed to simplify the management of multiple monitoring and Observability Realms.
Each Realm operates as an independent environment, with its own configuration, resources, ports, and backup paths.
The wocu-ctl tool provides centralized management capabilities, allowing administrators to start, stop, update, inspect, and troubleshoot individual Realms or multiple environments.
This new deployment approach improves operational flexibility, simplifies maintenance, and facilitates the management of isolated monitoring environments on shared infrastructure.
Moving Towards More Proactive Monitoring
With Release 74, WOCU-Monitoring continues to evolve towards a more intelligent, flexible, and efficient monitoring platform.
The combination of metric forecasting, enhanced anomaly analysis, customizable dashboards, and simplified administration helps IT teams anticipate potential issues, improve operational visibility, and manage complex infrastructures more effectively.
For a complete description of all new features, improvements, and fixes, please refer to the official release documentation.