When we talk about monitoring, we always need to define the situation we are in because, like tastes, there are many types of monitoring.
Some questions that can help us understand the context we are in could be…
Who initiates communication?
Is monitoring done at regular intervals (always the same)?
Or only when certain thresholds are exceeded?
Is an action triggered when a certain event occurs?
If you know most of the answers, you have things quite clear, and sometimes we are not aware of how little we know about our infrastructure until we get to monitoring.
If, on the other hand, these questions create doubts for you, I invite you to refresh some concepts by reading the blog post I wrote some time ago about active monitoring vs. passive monitoring.
The Best of Both Worlds
In that post, I mentioned that the ideal is to unify both types of monitoring. With WOCU, we offer you both methods: on one hand, you have active monitoring with the monitoring engine, and on the other hand, passive monitoring with the event indexing backend based on Elasticsearch.
From the modals and tabs of Assets and Problems, we access the results of active monitoring.
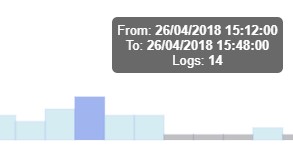
And in the Events -> Logs tab, we find the events that come from passive monitoring.

However, until now, when a passive monitoring event arrived, only the indexed event icon appeared, but it did not create an alert as such.
![]()
We thought we had to unify both worlds, and we found a way to do it.
A Pack for Each Thing
I don’t know if you’ve noticed that we have a Monitoring Pack (Active) that checks passive monitoring events. When passive events arrive from devices that you are also actively monitoring, you have a 360º view of what is happening on the same tab.
To show you how this useful pack works, I’ve made a video for you, and be careful because at the end I’ll give you a challenge 😉 Do you accept it?


