2024 has been an exciting and challenging year at WOCU-Monitoring. It’s time to reflect and assess some of the achievements we’ve reached.

In this post, we present the top 10 features and key milestones that we launched throughout the four releases published last year:
Release 59
Release 60
Release 61
Release 62
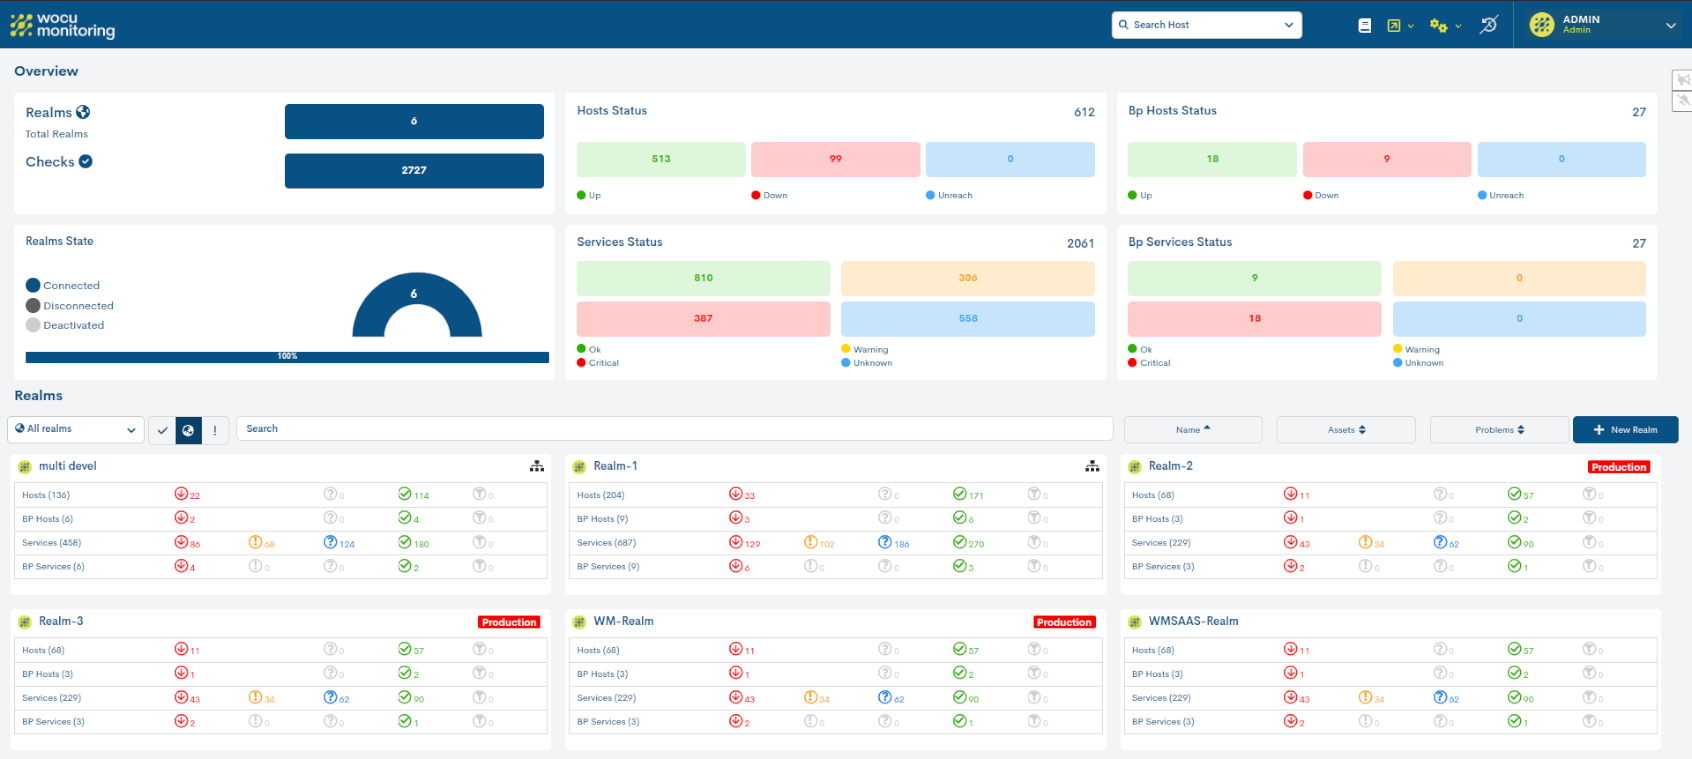
1. New Look & Feel
WOCU-Monitoring introduces a revamped interface with a more modern and agile design. The graphical engine has been updated to enhance the user experience, resulting in a faster, more intuitive, and visually adaptive tool.
Usability:
User-centered design.
Simplified and intuitive navigation.
Reorganized menus with redundant sections removed.
Unified data to improve interaction between user and platform.
Visualization:
All operational views are now customizable, with KPIs displaying data based on applied filters.
Configurable tables (move or hide columns).
Enhanced Global View (Home) with new charts and realm status overview.
Device detail view now features more accessible, editable, and organized information.
What’s next:
Upcoming features include fully customizable dashboards, advanced reporting, and multiple assistants to streamline setup and usage.
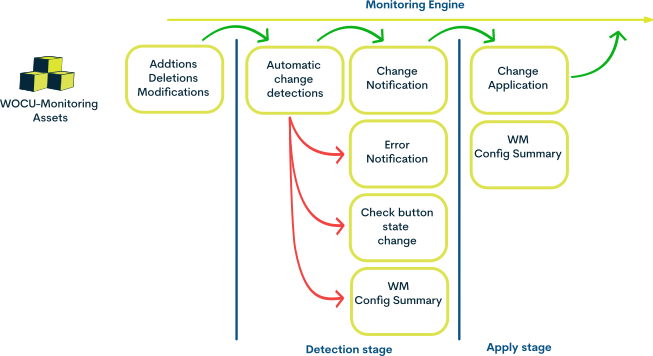
2. New Automatic Configuration Management System
A major improvement has been introduced for managing asset configurations in WOCU-Monitoring. Changes related to asset additions, deletions, or modifications whether made by users or automated tasks are now applied in real time, without the need for manual actions or engine restarts.
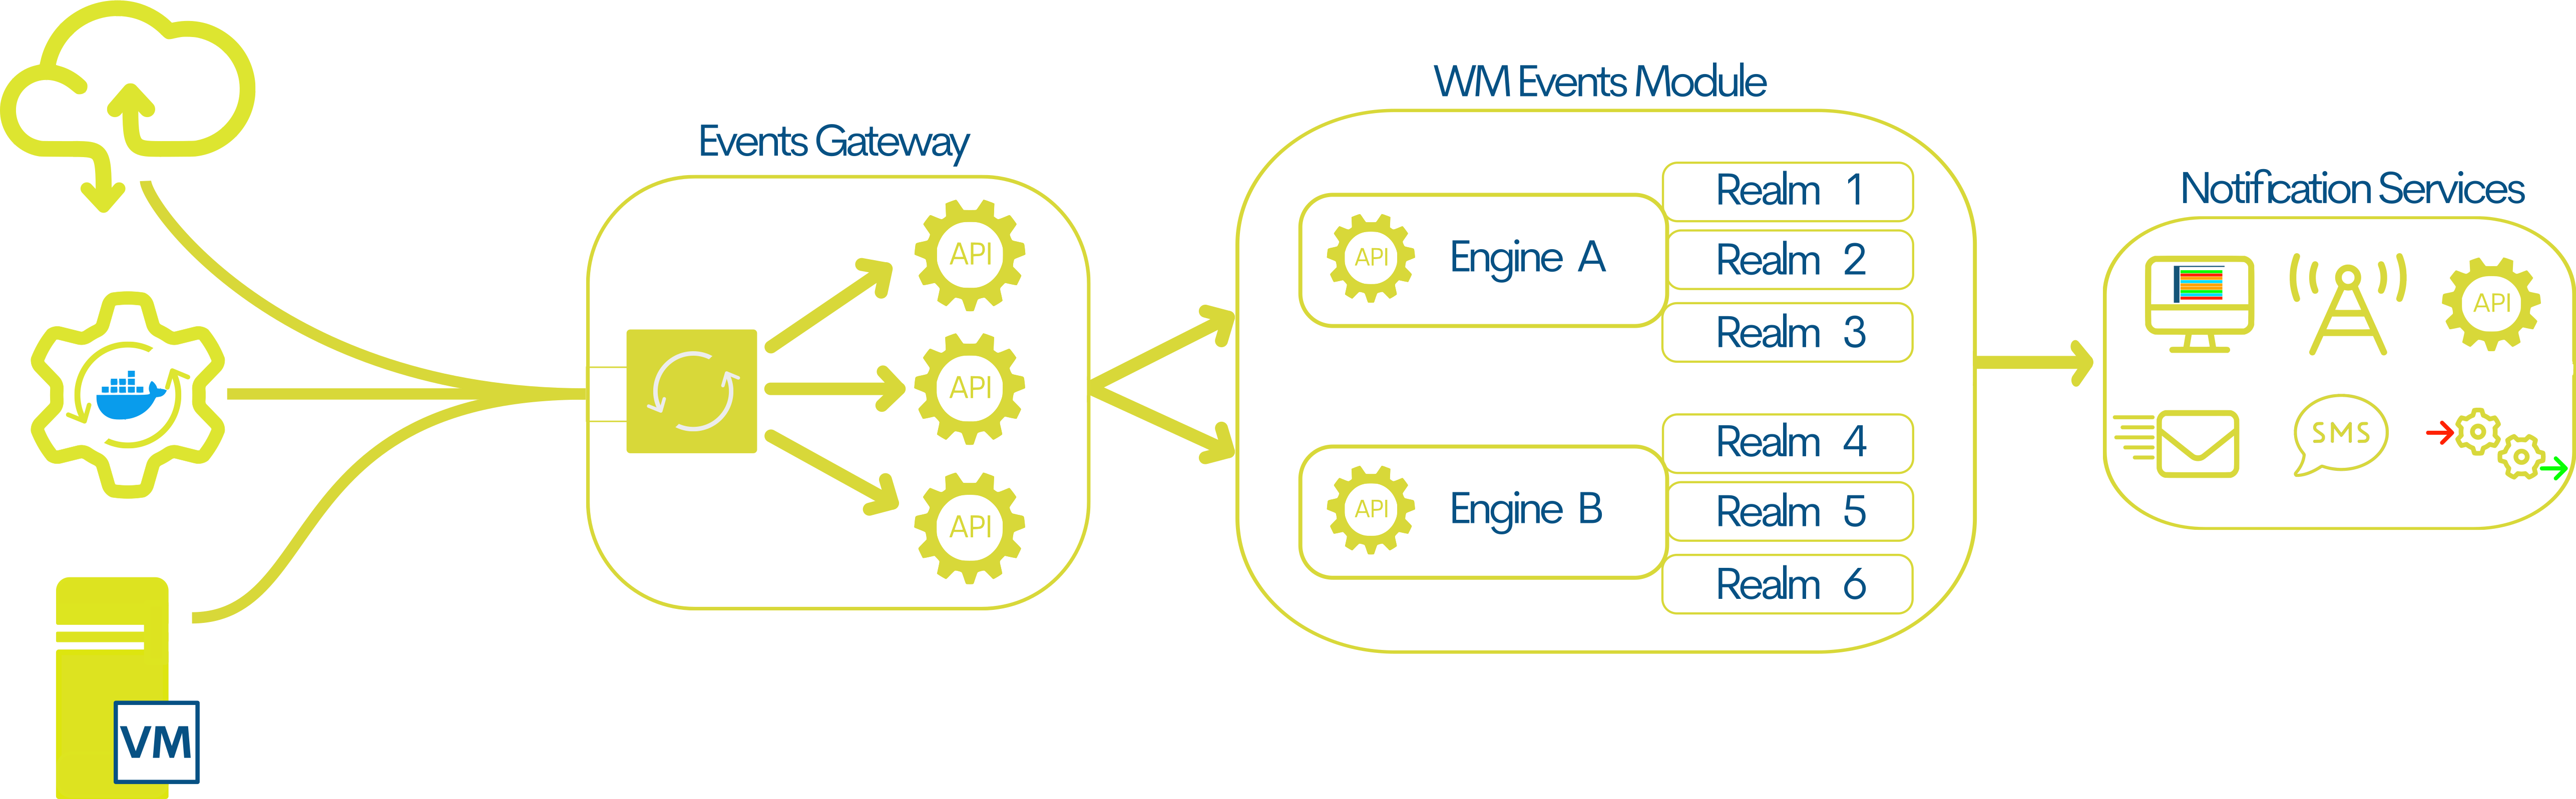
3. Monitoring via Asynchronous Event Reception in Secured Public API
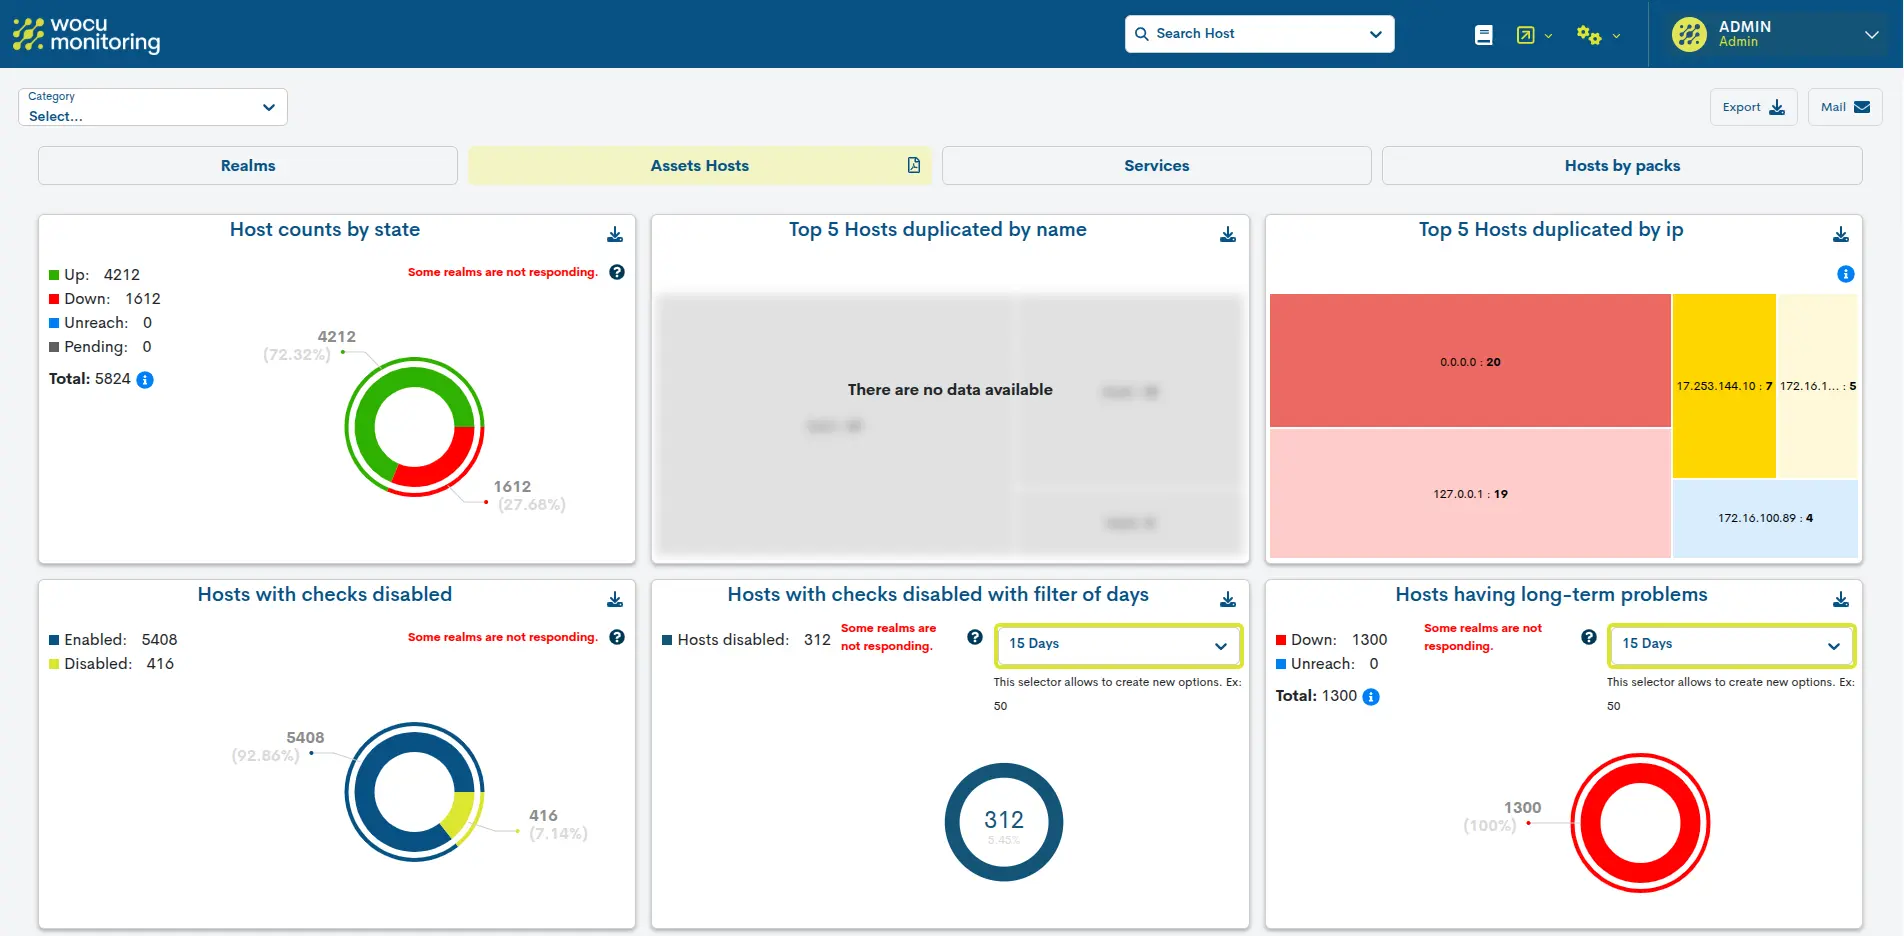
4. New Aggregator Summary View
A new option has been added in the Settings menu, introducing the Aggregator Summary view. This tool is designed to provide a comprehensive overview of the monitored infrastructure, focusing on the nature, connectivity, and configuration of Realms and their associated assets at the time of access.
The view is organized into multiple sections:
Realms
Realms and Multirealms
Standard and HG Realms
Connected and Disconnected Realms
Assets – Hosts
Host counts by State
Top 5 duplicated Hosts by Name
Top 5 duplicated Hosts by IP
Hosts with checks disabled
Hosts with checks disabled (filtered by days)
Hosts with long-term problems
Services
Service counts by State
Services with checks disabled
Services with checks disabled (filtered by days)
Services with long-term problems
Hosts by Packs
Hosts by Pack State (with Packs configured)
Hosts by Pack State (with specific Pack)
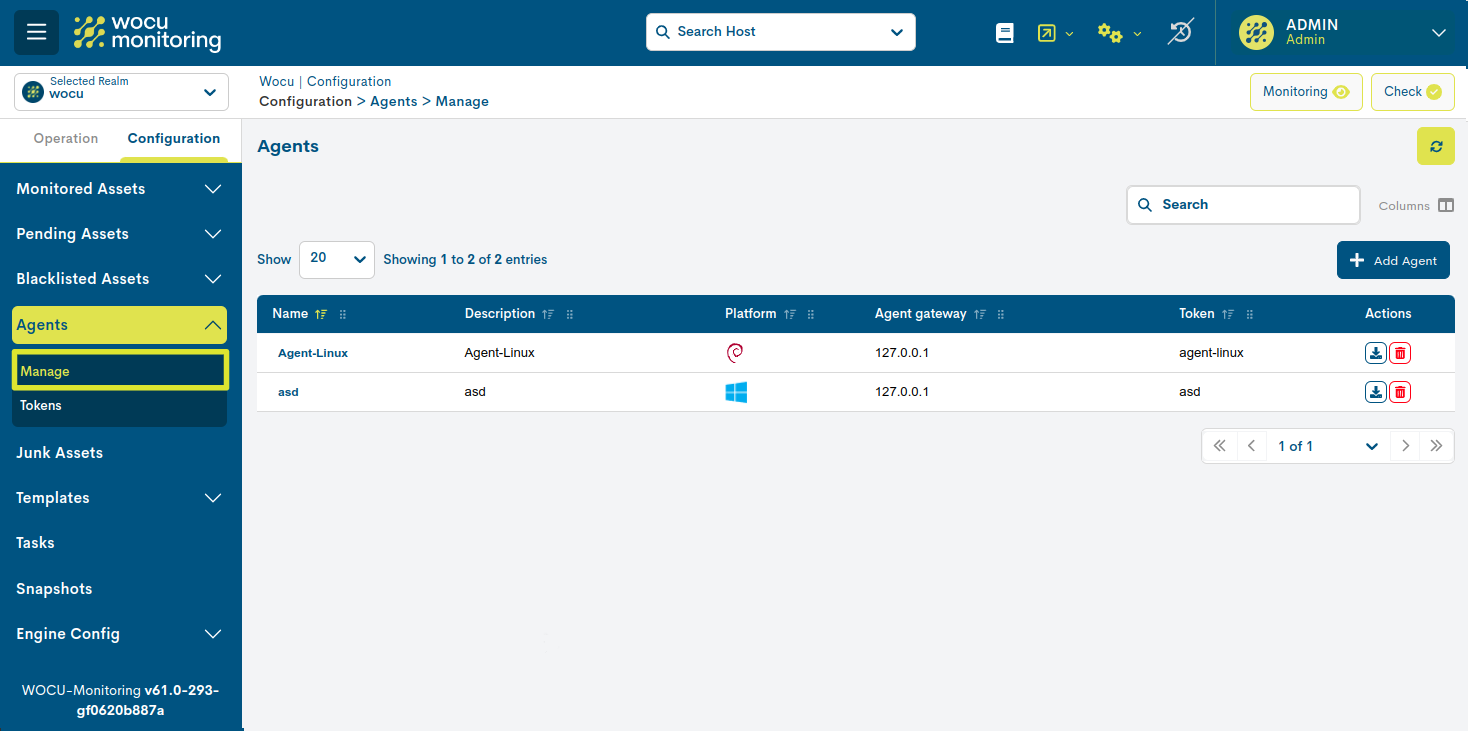
5. Monitoring via Agents
WOCU-Monitoring introduces a new Agent-based Monitoring Module designed to optimize the collection and transmission of system information and logs from devices running Windows, Debian, or RedHat, in a secure and autonomous manner.
Main Features:
System Data Collection: Agents gather system data including hardware, software, and running processes from the host machine.
Secure Data Transmission: Information is sent to a designated URL using a token-based authentication mechanism, ensuring that only authorized recipients can access it.
Centralized Management:
Register and configure new agents from the Manage view.
Administer and link tokens for communication authentication from the Tokens view.
6. SNMP TRAPS: Improved TRAPS Processing
The new Router-TRAPS module is a powerful middleware solution designed to centralize the reception of SNMP TRAPS from multiple sources into a single entry point. This functionality boosts the performance of WOCU-Monitoring and reduces administrative workload.
Centralized TRAPS Reception: Enables ingestion of a high volume of SNMP TRAPS, even in demanding environments, without performance issues.
Efficient Routing: Once received, TRAPS are redirected to the appropriate WOCU-Monitoring Realms, where they are processed and generate events based on the configured services.
Higher scalability and performance in managing SNMP TRAPS.
Reduced Mean Time to React (MTR) by streamlining event processing.
7. New Global Problems List
WOCU-Monitoring has unified the Alarms (Problems) view into a single table that consolidates all detected incidents across Devices, Associated Services, and Business Processes.
Users benefit from a redesigned interface and can now manage all issues and perform common operational tasks from one centralized location.

8. New Event Ingestion Management System
A new module has been developed to handle the queuing of events from external sources. From now on, the monitoring engine will read messages directly from the queue and generate the corresponding event.
This innovation leads to a significant reduction in alarm notification times by eliminating periodic polling.
WOCU-Monitoring now offers real-time infrastructure monitoring without generating additional traffic or unnecessary queries, greatly enhancing system performance.
9. Enhanced Service Metrics View
WOCU-Monitoring has improved the Service Metrics modal by adding visual enhancements and export functionalities:
Dynamic Thresholds:
Service graphs now support dynamic thresholds, allowing SLA limits to adapt within predefined ranges. Warnings and Critical states are now visualized according to these flexible thresholds, improving SLA management.Unified Metric Series Display:
All series from a single service metric are now displayed in a single graph, enabling better comparison and broader monitoring in one view.Null Value Representation:
Metrics graphs now show dashed lines for time periods with no data, making it easier to identify data gaps.PDF Export Function:
A new Export button allows users to generate a PDF report containing all metric graphs for a specific service. If there are many graphs, the report spans multiple pages.
This improves information sharing and supports better decision-making.
10. Packs
Throughout 2024, the functionalities of a large number of monitoring packs have been expanded, and new packs have also been added to increase device coverage.

![]()

![]()
a