WOCU wraps up the year by positioning itself as a stable, dynamic, adaptable, and competent tool within this diverse market. This achievement wouldn’t have been possible without the uninterrupted efforts of our entire team and the trust our clients have placed in WOCU.
Undoubtedly, it has been a different year, but by combining efforts, we have been able to overcome it with each of the developments integrated into the various versions released throughout 2020.
And in case you missed anything, here are the top 10 standout features and key milestones we have launched during this year.
 For 2021: We aim to continue climbing positions!
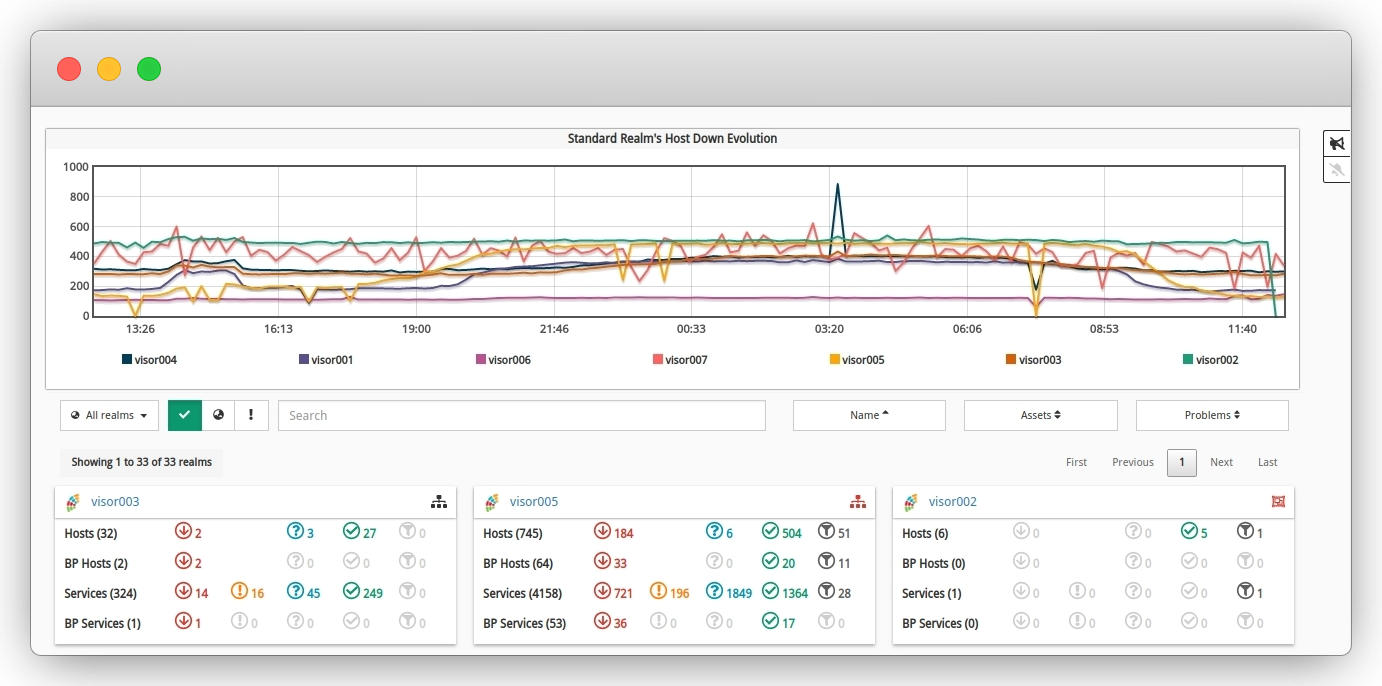
1. New Evolution Graph for Realms with the Highest Incident Count
We enhance the initial infrastructure status monitoring view with a graph that depicts the evolution of realms with the highest number of incidents recorded in the last 24 hours. It illustrates the evolution along with the sum of downtimes for assets integrated into standard realms. Additionally, it enables interaction with the graph to access precise data recorded at specific points. With this integration, we continue to centralize information in the unique aggregation console without having to resort to other external tools.
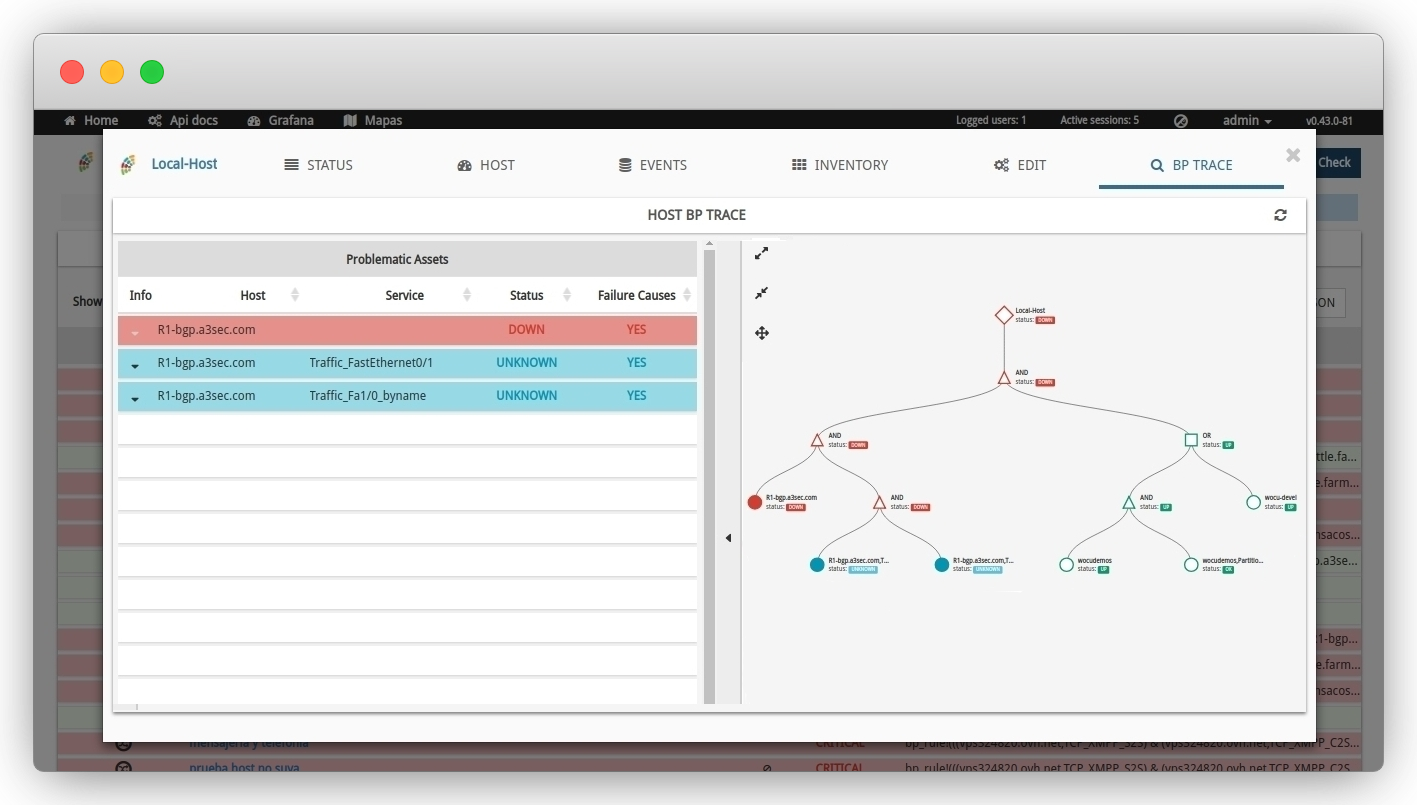
2. Functional and Operational Enhancement of Business Process Modeling
WOCU allows the grouping of hierarchical dependencies of assets into vital Business Processes, represented in the BP Trace tab. After several versions, we have achieved a more powerful, functional, clear, and precise view of business operation and availability. Among many other features, we highlight:- Processing and rendering of nested Business Processes, i.e., integration of other Business Processes among their members.
- Root cause localization of anomalous monitoring states, specifying the assets causing the total process downtime.
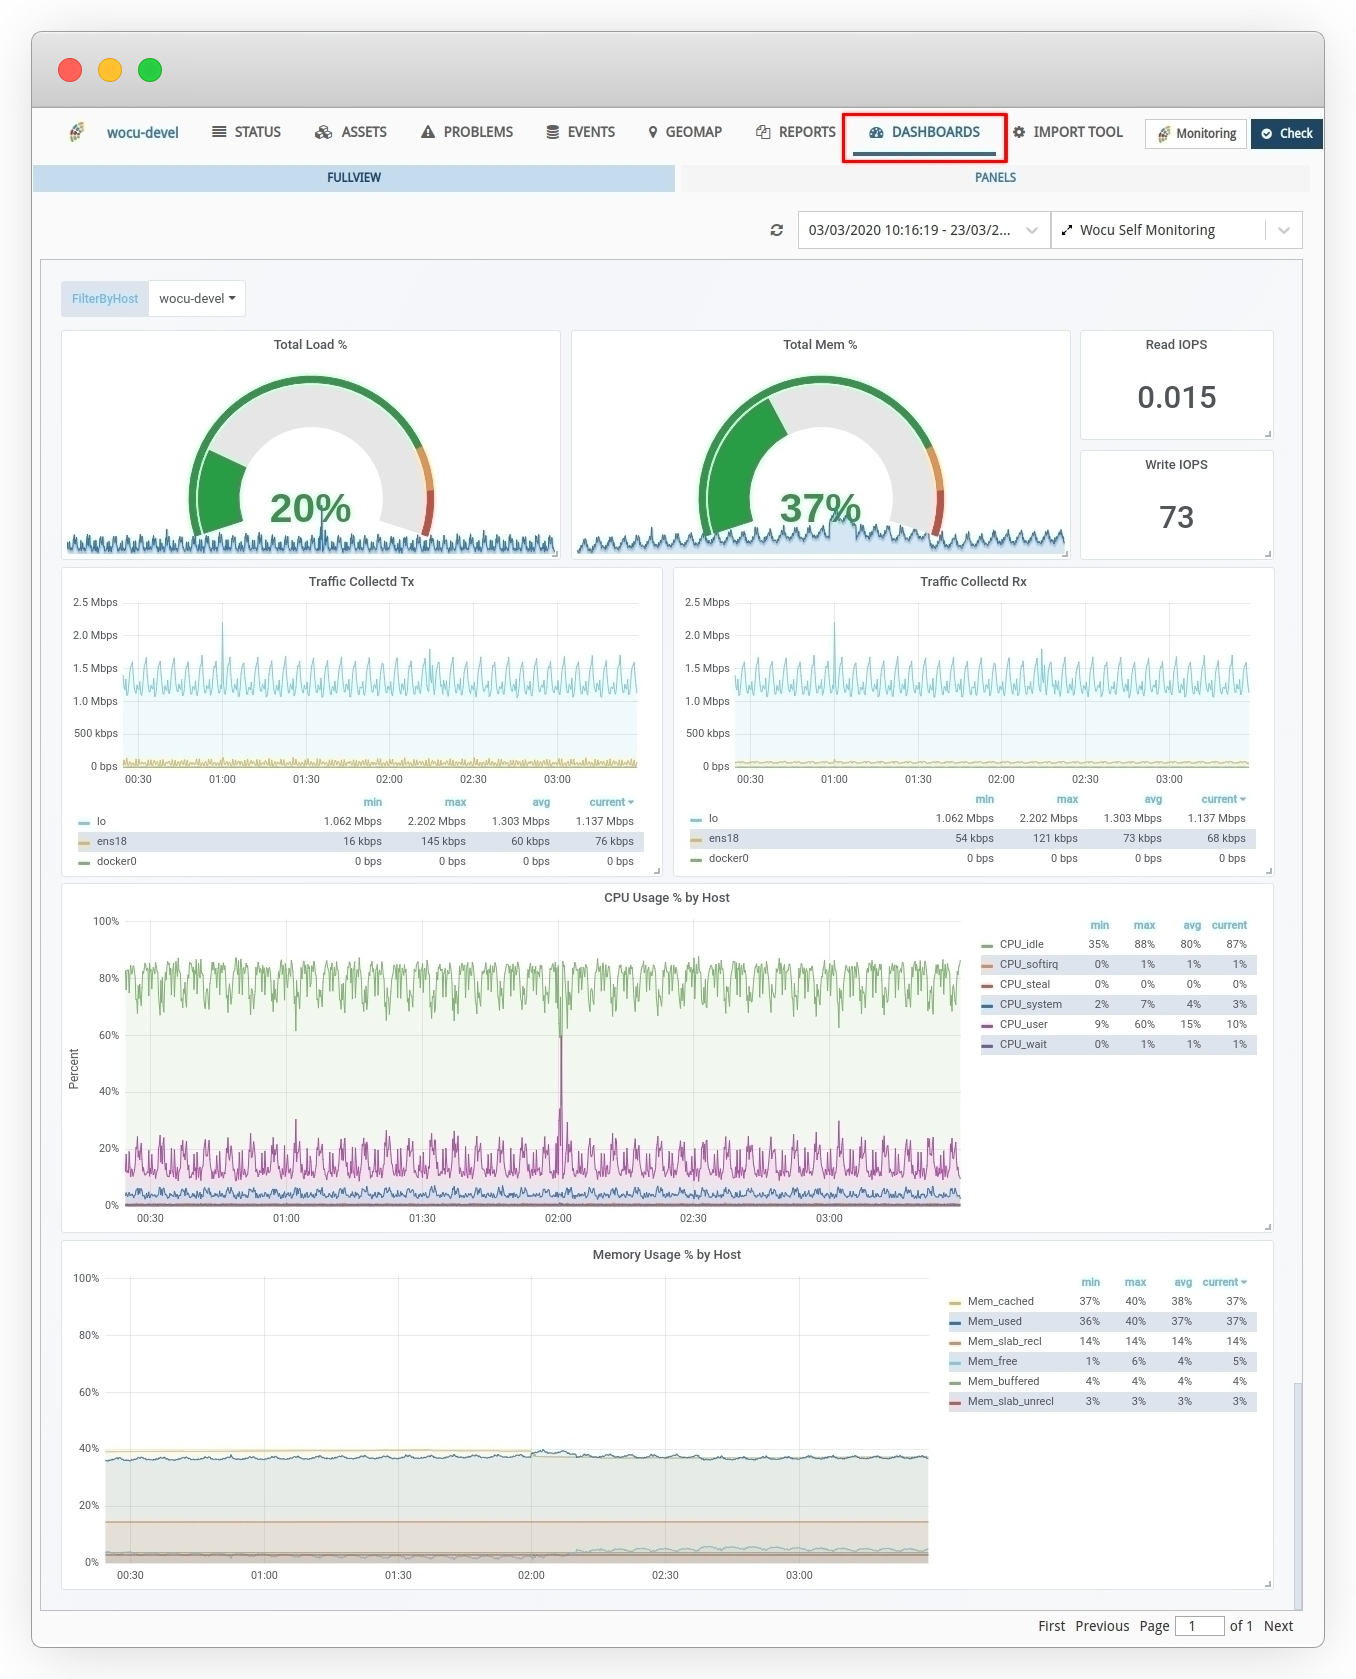
3. Aggregation of Exported Dashboard Views
Another feature that sets WOCU apart is its ability to integrate third-party applications, avoiding the need to forgo the advantages of each existing system in any company. Therefore, work was done on the integration and visualization of exported analytical dashboard views from external tools to WOCU, under the operator’s free choice and customization. The goal is to export and integrate monitoring dashboard views of deployed device health, ensuring that all recorded values can be displayed in various widgets, such as bar graphs, pie charts, data streams, etc. UI-ACL support was also incorporated into dashboard configuration, allowing the operator to configure access by user type.
4. Complete Migration to Python 3
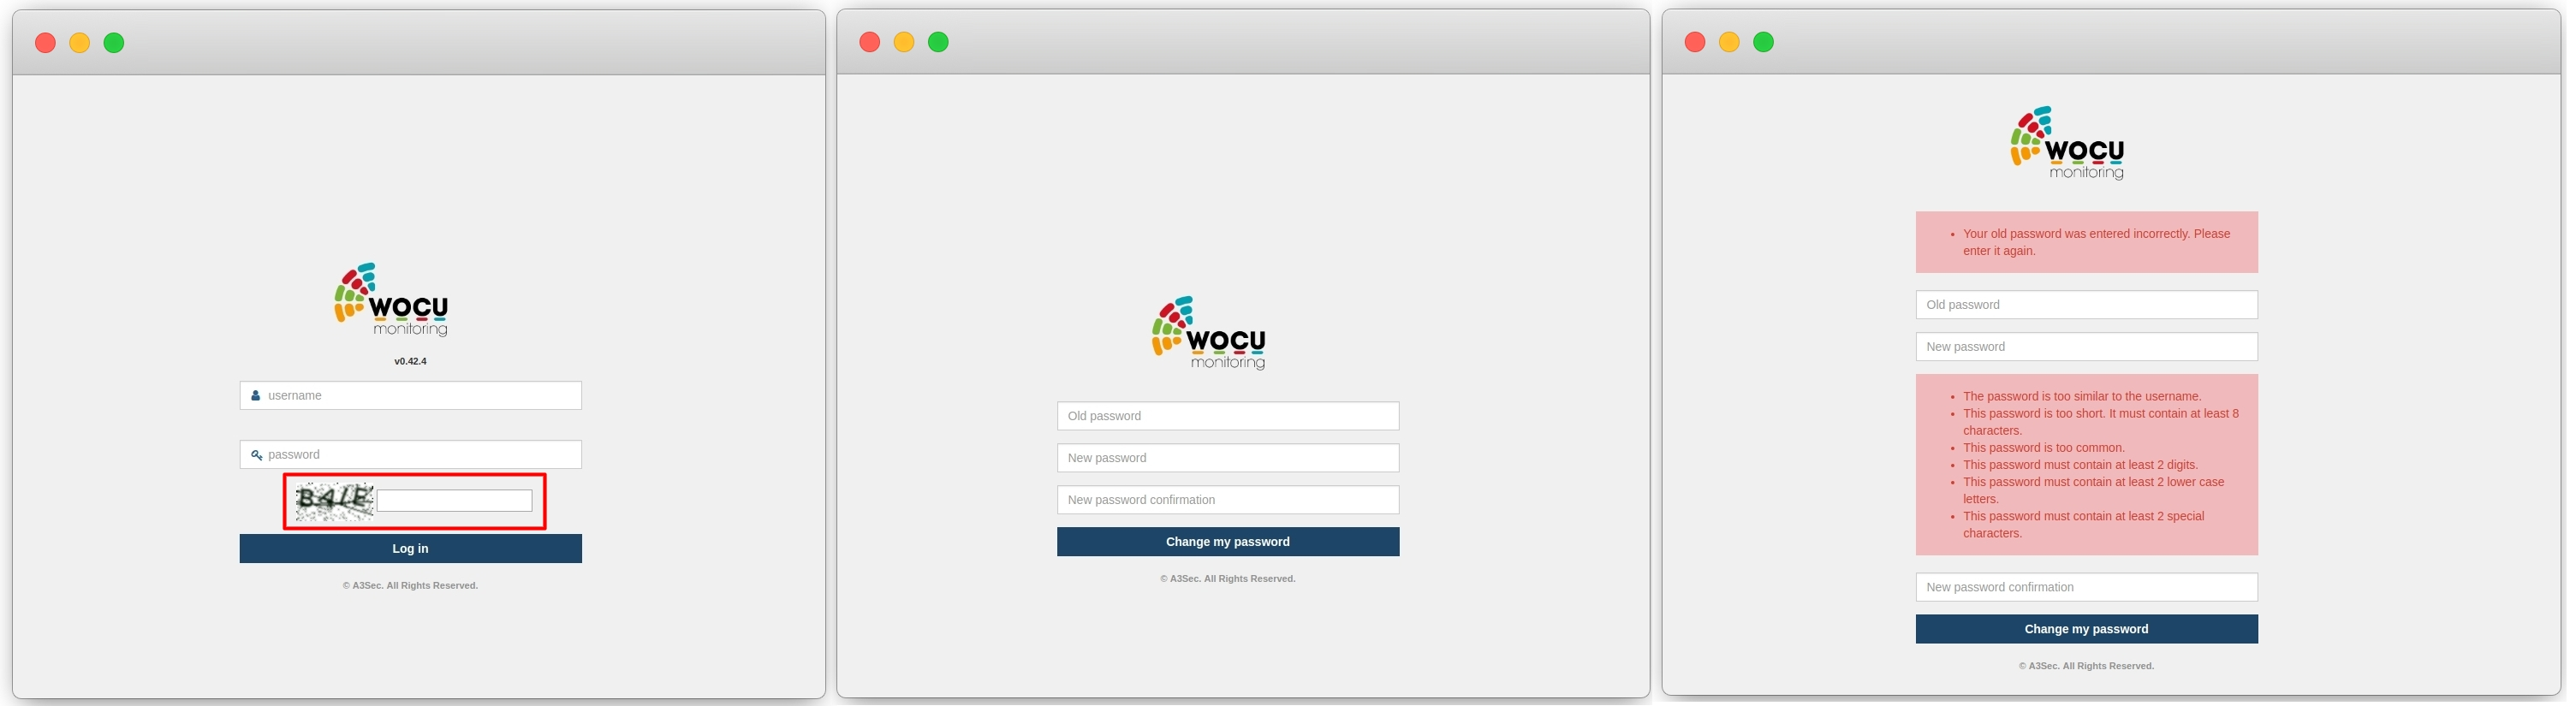
One of the most significant milestones of this year, and one we are very proud of, has been the complete migration of WOCU code to Python 3. This makes WOCU a fully maintainable and long-lasting project. The migration includes: aggregator backends, import-tool, the common python-wocu library, and the checks used in monitoring packs. This culminates in the improvement of our Continuous Integration processes, incorporating more meticulous automatic code review and analysis jobs.5. New Security Module
Given the growing trend of security threats and attacks, WOCU prioritized developing a set of preventive protection measures to counter intrusive and unauthorized actions, security failures, or other vulnerabilities that could jeopardize our clients’ activity. As a result, WOCU concludes the year with a powerful additional Security Module, aimed at clients meeting specific security needs and conditions who choose to protect themselves, with assurance, from possible malicious movements. In general terms, this service combines a set of effective measures, which, together with user education, solid integrated authentication, and a strict blocking policy, mitigate any risk of intrusion and malicious activity.
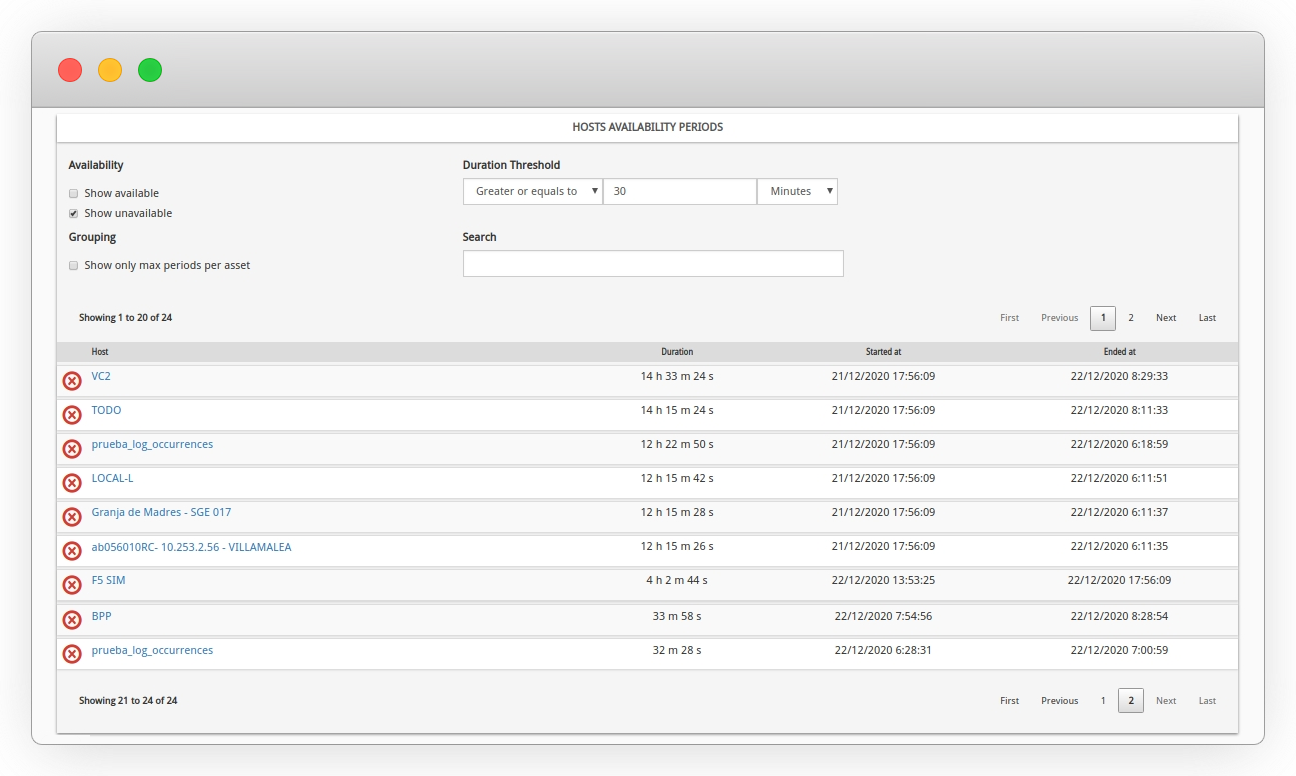
6. New Availability Periods Report
Availability is one of the main performance and operability measurement indicators, as well as a concept subject to varied configurations. For all these reasons, and as a complement to other reports, a new Availability Periods Report has been added, intended for compiling temporary periods of operation of each element comprising the monitored technological infrastructure. In other words, this report answers questions such as:- Which equipment has been down for more than 5 consecutive hours last month? How long did my provider take to resolve the incident?
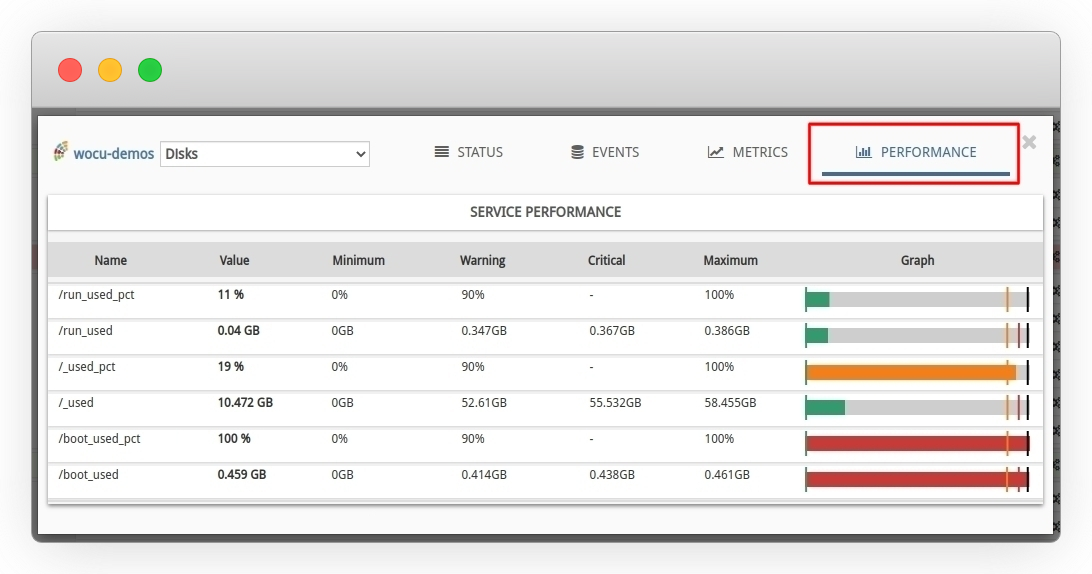
7. Independent View of Performance Data Metrics
Another useful integration in terms of distribution and supply of data processed and stored by the system is the new Performance view, where all monitoring metrics along with their performance values, recorded by each service, are collected as a result of continuous checks in terms of operability towards network elements. In general terms, the view includes monitoring metric data, established measurement thresholds, and simple graphs for each metric. Thanks to WOCU’s versatility in managing countless Monitoring Packs, services, and metrics of different kinds, it is possible to generate performance tables that allow for a detailed study of the real network situation, as well as help identify performance and capacity problems and errors.
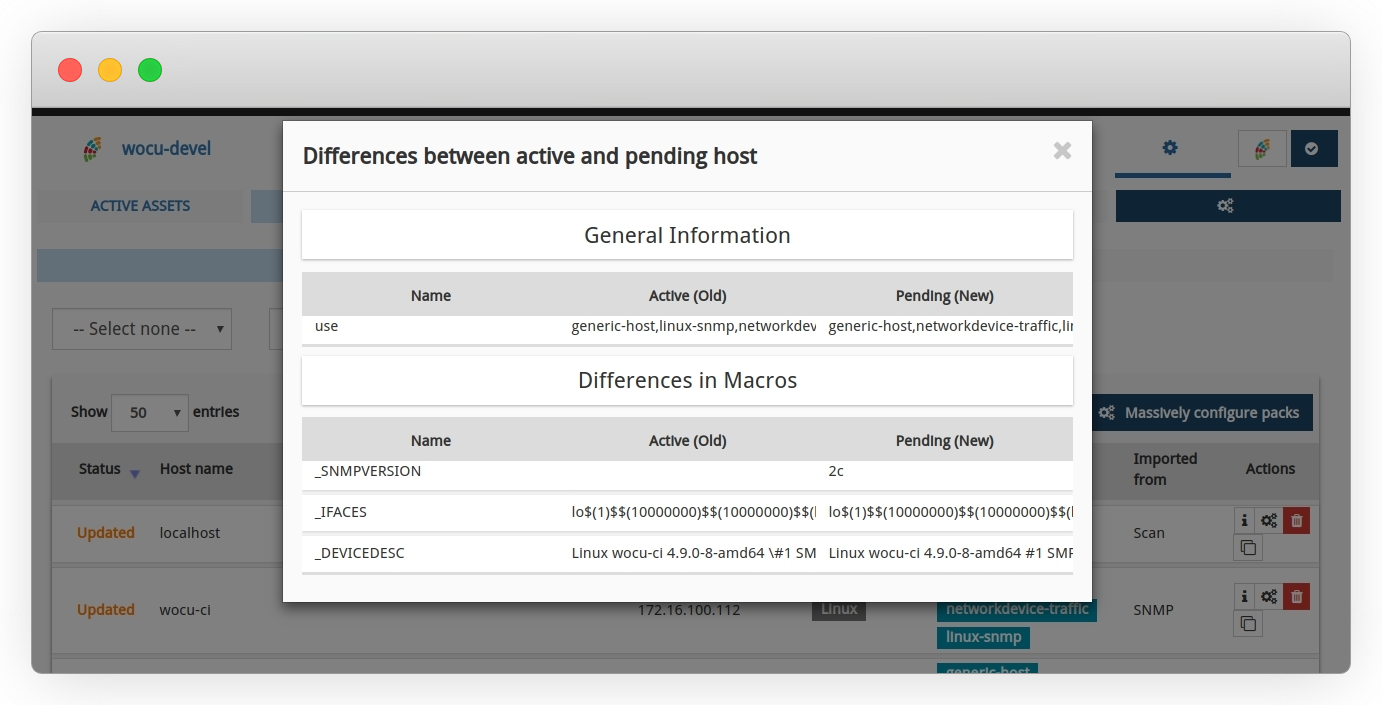
8. Configuration Data History after Asset Updates
Although this functionality is purely informative, it has become an essential part during the import and self-discovery of devices, services, interfaces, etc., resulting from the launch of Tasks. Thanks to the new individual option Differences, it is possible to know the main differences in terms of configuration and parameterization that a newly rediscovered asset has undergone and, consequently, is back in the database of assets pending monitoring. This implies that the operator can observe the differences between both versions and decide which configuration profile interests them, to proceed with its inclusion in the monitoring plant.
9. Publication of WOCU API Documentation
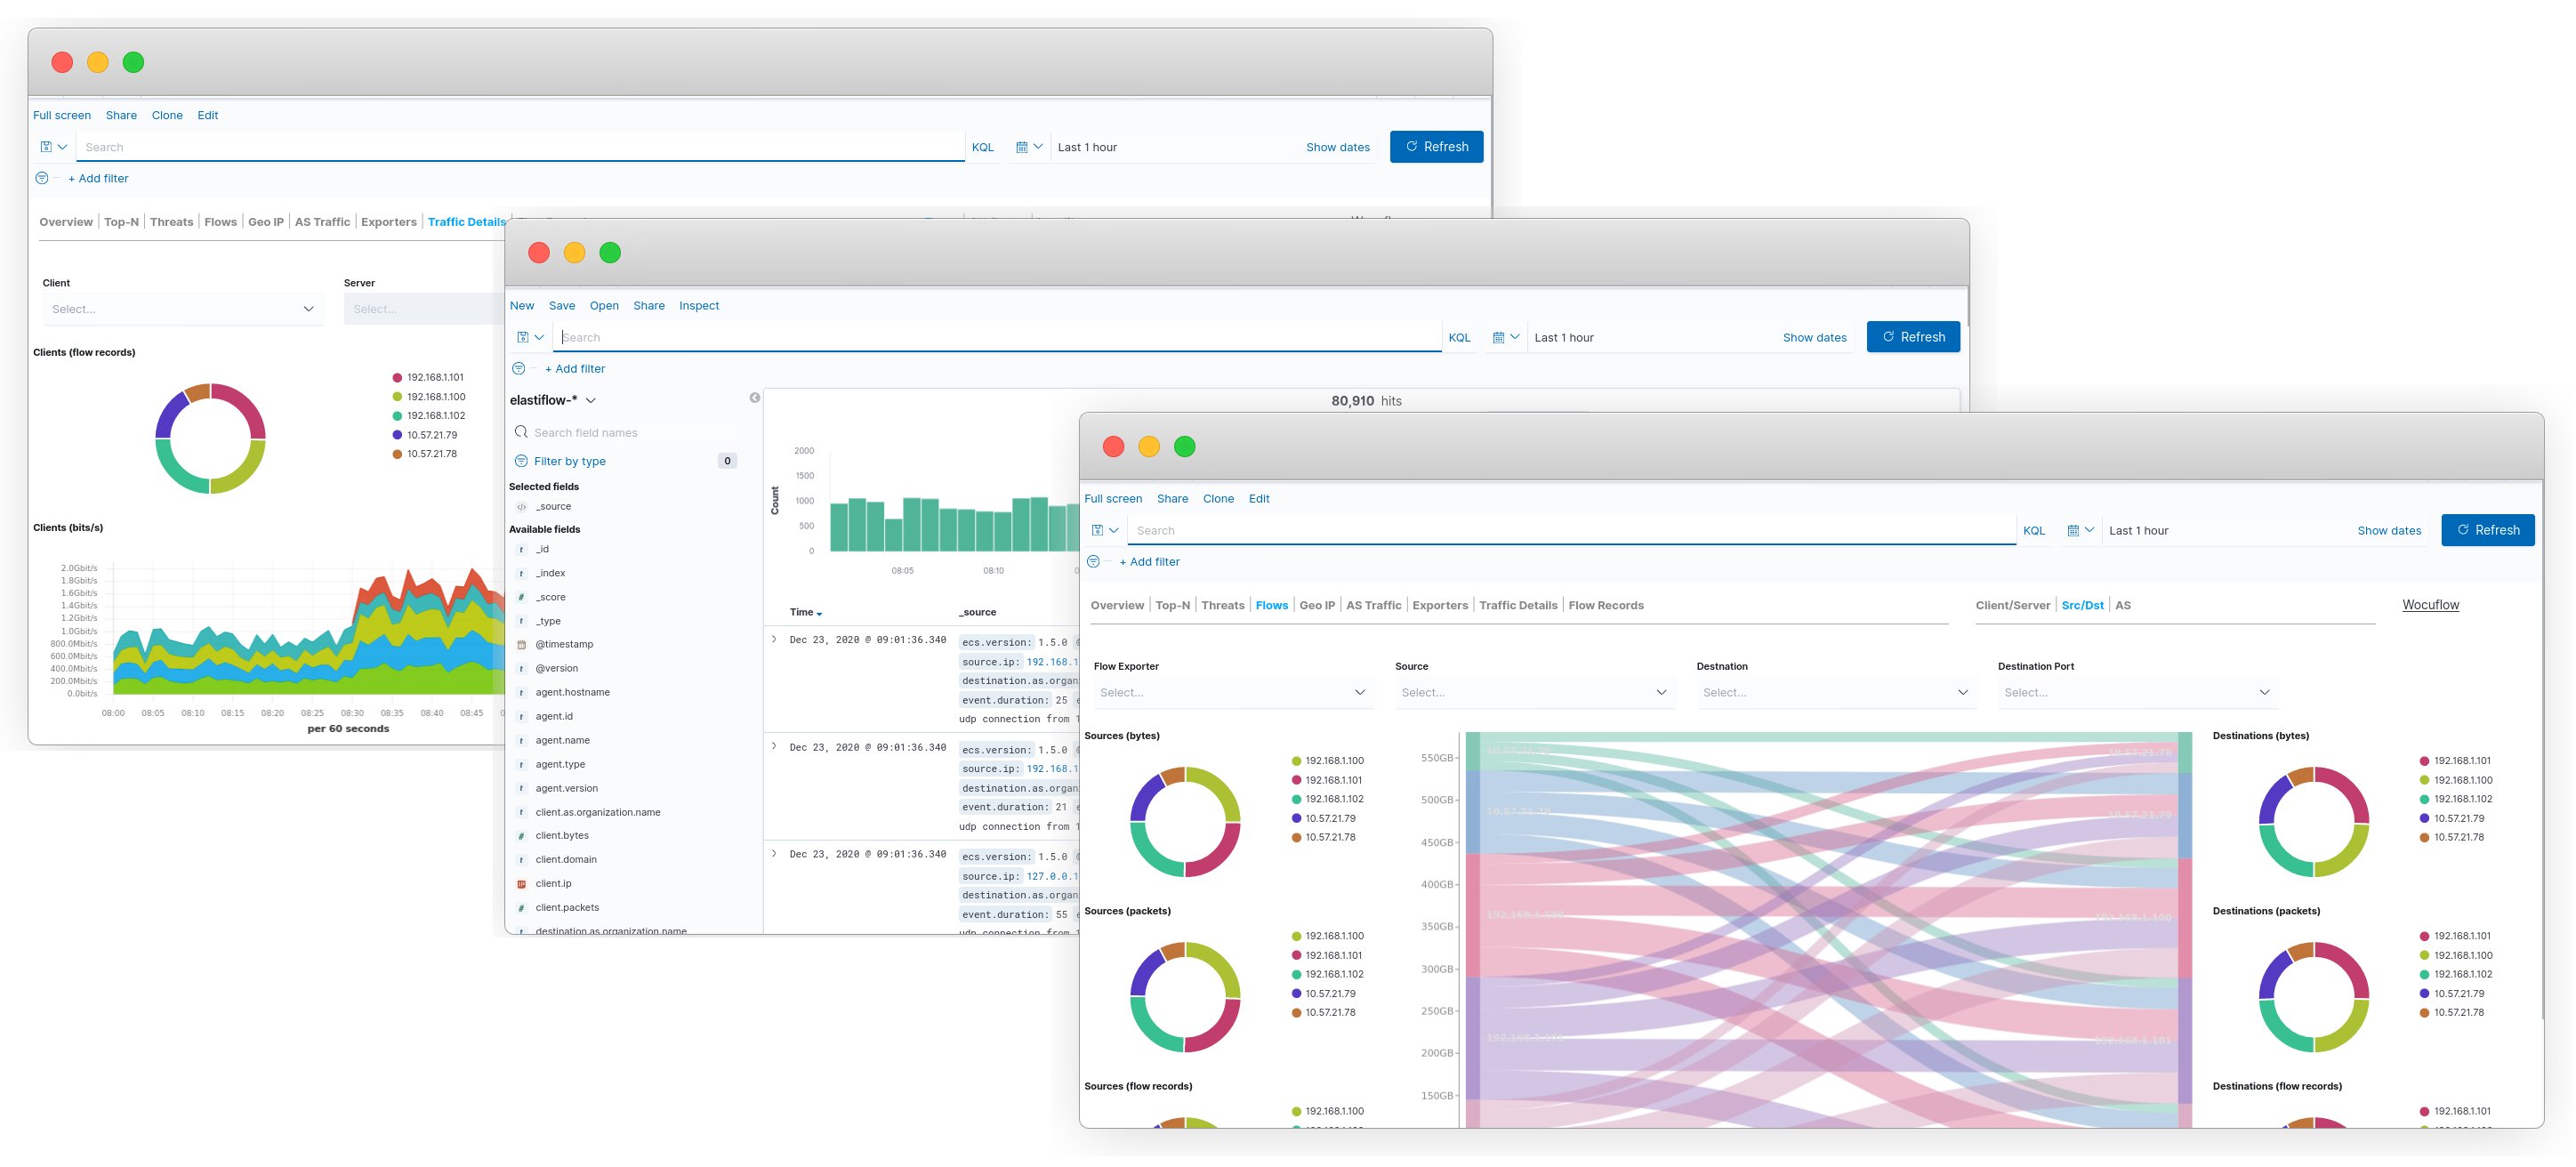
We have also made public the complete documentation of the WOCU API, including a new independent section in the User Manual. We understand the importance of documenting and providing the API to facilitate integration with third parties and to speak the same language.10. New Flow Analysis and Monitoring Module: WOCU Flow
And lastly, a preview for 2021! Given the need to monitor applications through data flows, WOCU is developing a specific module for netflow monitoring, which will be released next year. This module will be able to capture Netflow (versions 5, 9, ipfix) and Sflow data flows, store them, and display them in the WOCU interface. Since it is based on Open Source software (Elasticsearch, Logstash, and Kibana), it can be modified and adapted to each client’s requirements. WOCU Flow will also provide a tool to manage the flow capture platform, being able to start and stop probes on the fly, as well as control the allowed bandwidths on each probe.
For 2021: We aim to continue climbing positions!