We’re kicking off the year with a new version of WOCU!
You know we love sharing the latest updates and improvements to our monitoring solution, and this time, we have some pretty interesting changes.
First, we’ve enhanced some usability aspects. Now it’s easier to access the admin of the Import Tool, we retain the searches you make on the WOCU HOME, unify tabs, and hide sensitive information…
We’re also continuously thinking about ways to handle and serve WOCU information to improve the overall application performance.
And of course, we’re adding features that you ask for, helping make WOCU a more complete tool, like the new availability period reports 😀
As always, you can find all the details in the RELEASE NOTES, within the user manual.
Usability
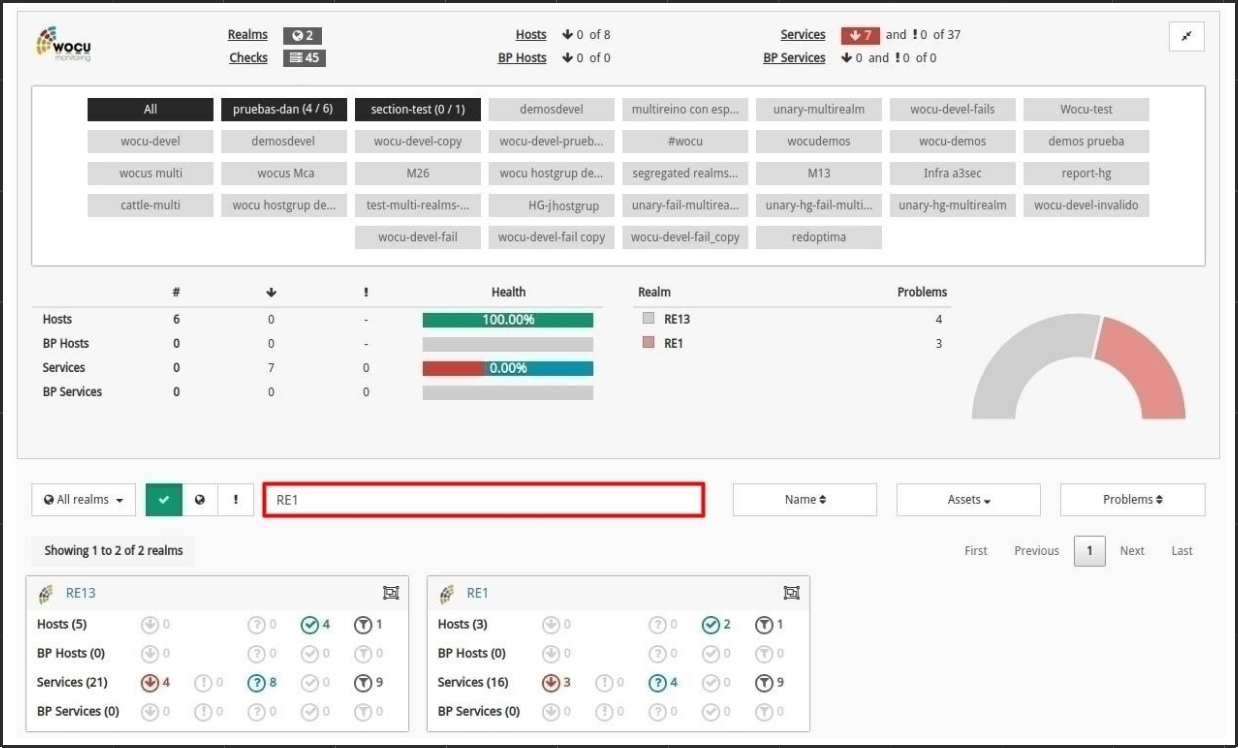
Saved search after reloading the aggregation page. In this version, similar to other filters, the Search filter will retain your search after reloading the page, ensuring you keep the search results.
Fig 1. Saved search after reloading the aggregation page.
New Evolution Graph of Most Troublesome Realms on the Home page
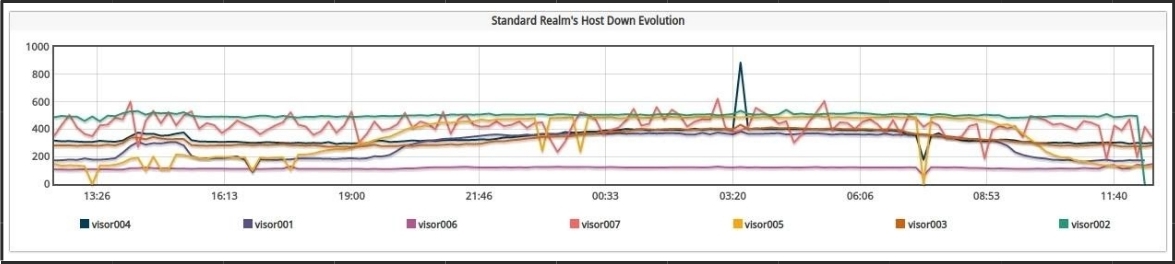
A new graph has been added to the Global View: Home, aiming to provide comprehensive and updated information on Realms monitored in WOCU. Specifically, this graph accurately presents the top ten standard Realms with the most incidents recorded in the last 24 hours. It shows the evolution along with the sum of failures of Devices (Hosts) and Business Process of Devices (BP Hosts), integrated into standard-type Realms only.
Fig 2. Evolution Graph of Most Troublesome Realms on the Home page
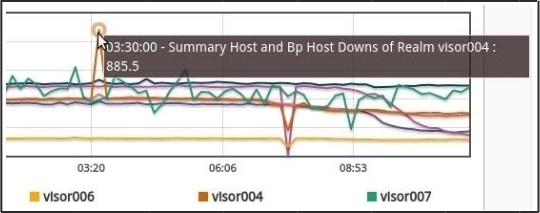
The vertical axis presents numeric values on a scale, while the horizontal axis expresses time (exact hour within the last 24 hours). Additionally, the graph offers the following functionalities: Hovering over any point on the graph will display a tooltip with the registered values for that specific point. WOCU will first indicate the exact time of the record and then the total failure count (sum of Devices (Hosts) and Business Process of Devices (BP Hosts)) of the specific standard Realm.
Fig 3. Tooltip Detail
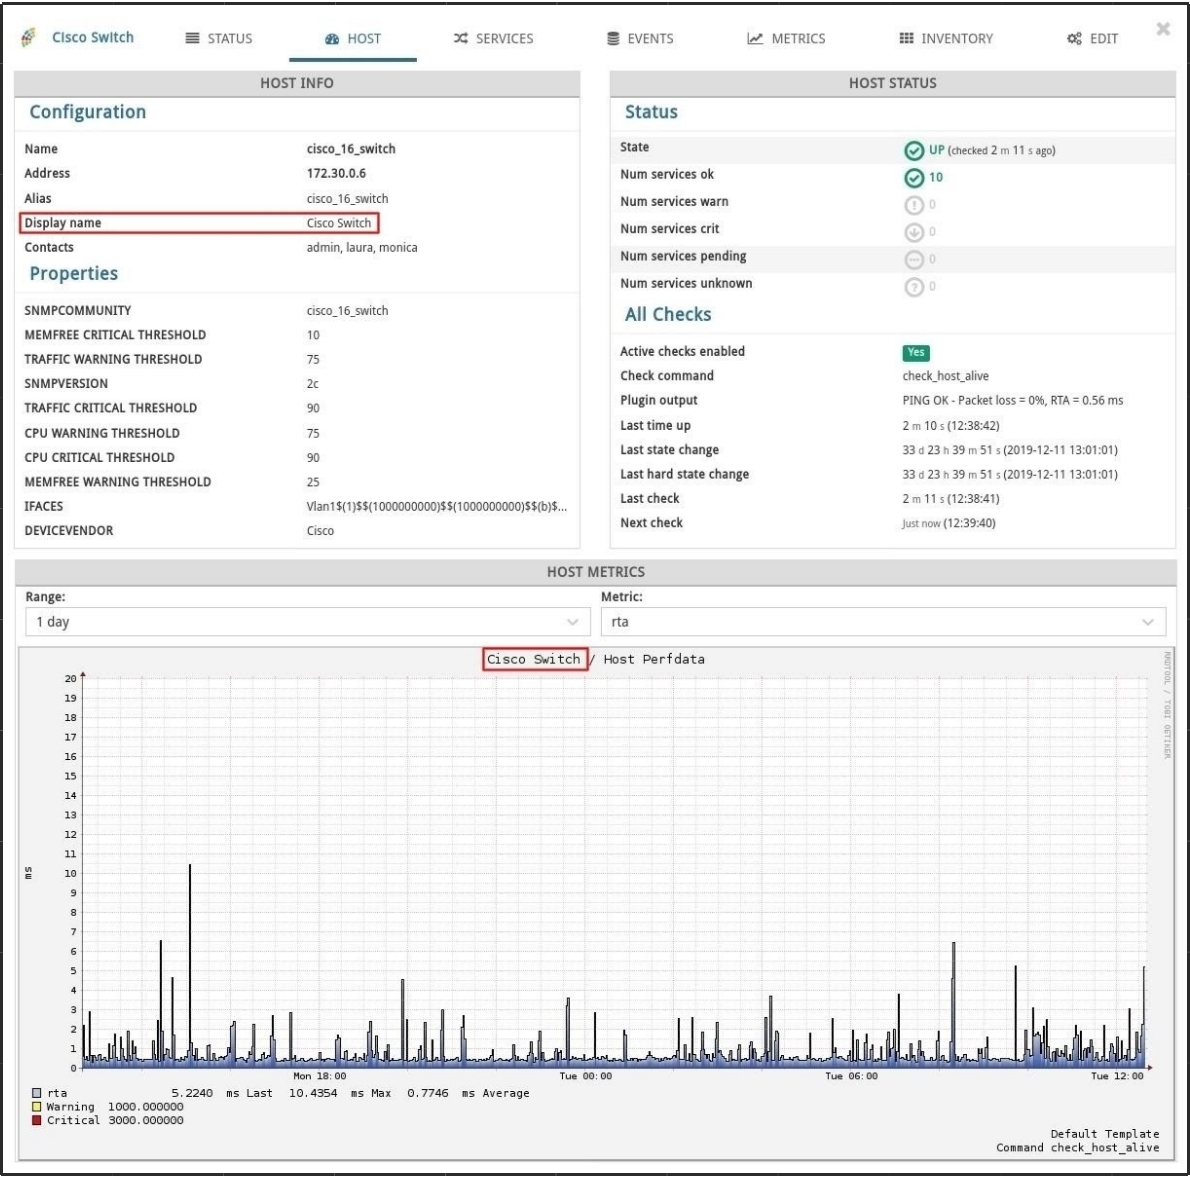
display_name Visualization in RRD Graphs
Every device in WOCU is identified by its host_name, which is a unique value and not repeated elsewhere in the device configuration. Due to the nature of this identifier, which typically uses numeric or mnemonic values, WOCU provides an additional value called display_name used to visualize the device name in the interface.
Fig 4. display_name Usage
In this new version, the display_name value is also used in the RRD metrics graphs, improving device identification by tool operators when consulting these types of graphs.New Access Button for Advanced Configuration in Import Tool
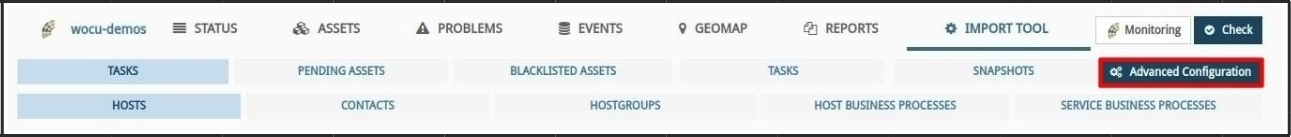
To streamline daily operations for Administrators, the Advanced Configuration button has been added within the Import Tool, redirecting users to the tool’s own Administration window.
Fig 5. Advanced Configuration Button
And if you think we’ve done a lot, I have to tell you there’s still more hidden in the RELEASE NOTES v.0.38