Monitoring Infrastructure with WOCU-Monitoring

When it comes to monitoring network infrastructures, we often think of routers, network interfaces, and traffic flows. But monitoring can go much further; we can obtain the number of free ports on a switch, usage of Quality of Service (QoS) classes, processor, memory, and disk load of a server, or the number of connections established by a firewall, proxy, DHCP, or any other network element, to name just a few examples. The metrics we can obtain are not only software-related; we also implement hardware health metrics. For example, we can obtain the status of fans or power supplies, as well as temperatures and processor speeds. Fig 1. CPU load, memory, and network traffic monitoring

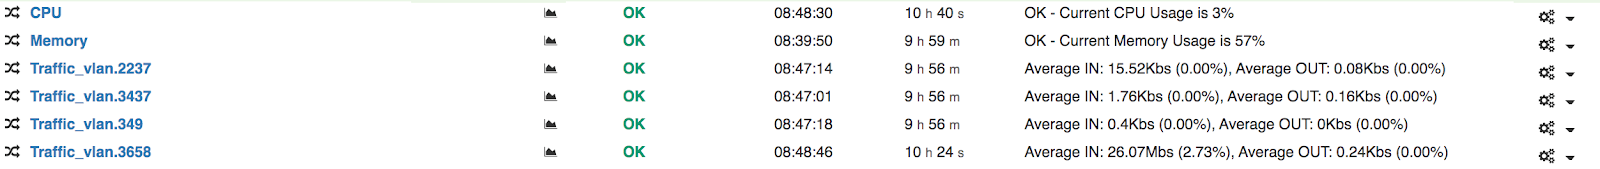
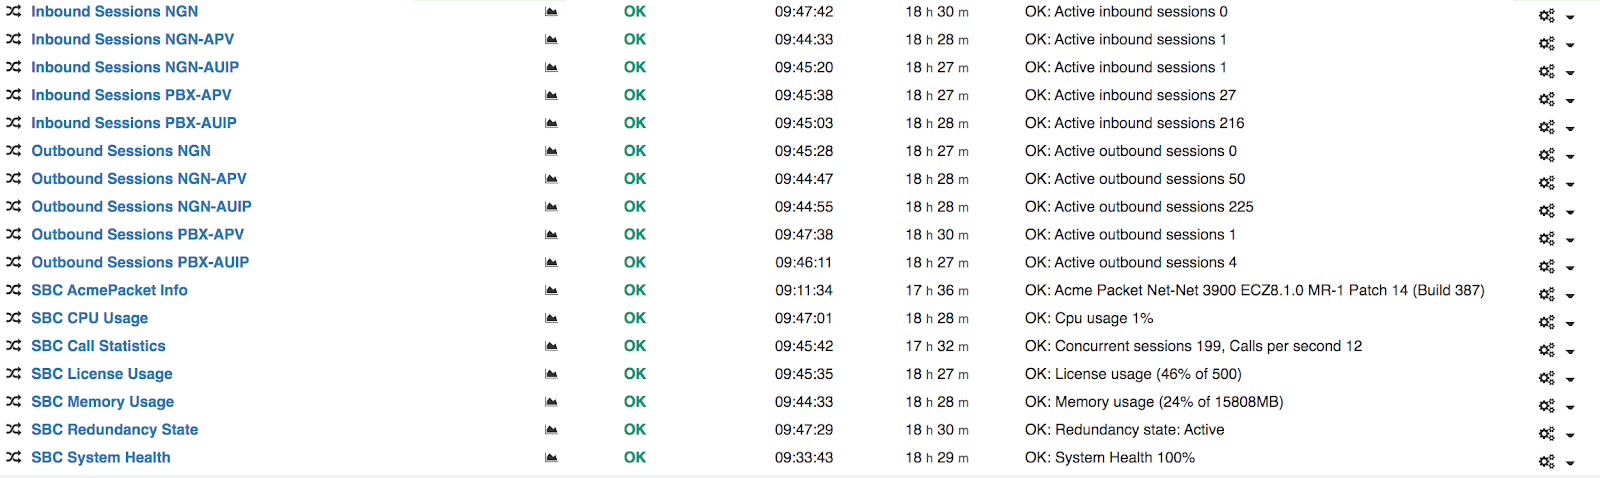
Fig 1. CPU load, memory, and network traffic monitoring.

Fig 2. Cisco Controller Access Point Monitoring

Fig 2. Cisco Controller Access Point Monitoring.

Fig 3: Oracle SBC Acme Packet PBX Monitoring

Fig 3. Oracle SBC Acme Packet PBX Monitoring.

Manufacturers (Categories and Brands)

In the WOCU monitoring tool, we support routers and switches, but we also monitor firewalls, proxies, load balancers, bandwidth managers, SIEMs, IP PBXs, Wi-Fi access points, virtualization platforms, and storage arrays, among others. The way we decide which metrics to monitor on each device is by applying packs. For a more intuitive identification of which pack to apply in each case, we classify them by categories. In this way, we have packs for Network, Security, Hardware, Databases, Network Protocols, Virtualization, Operating System, VoIP, and Storage. Fig 4. View of monitoring packs by categories

Fig 4. View of monitoring packs by categories.

Given the different nature of the metrics and devices we monitor, some packs are applicable to equipment from different brands and models, such as packs that measure network traffic, number of routes, or interface errors and states. On the other hand, there are packs for specific brands and models, such as Checkpoint, Fortigate, Palo Alto, F5, Allot, Oracle, or Cisco Call Manager.

Data Acquisition (SNMP, Agents, API)

WOCU obtains the metrics it needs through different methods. The most commonly used method is SNMP queries, but it’s not the only one; we also use agents installed on the hosts to be monitored (Windows or Linux), and in other cases, we make queries to the API provided by the manufacturer.

Query Optimization

Monitoring large-scale infrastructures means having to perform queries on thousands of devices, and depending on the number of services configured per device, the total number of checks per minute can be quite high. For this reason, horizontal scaling capability is essential, and by simply adding poller devices responsible for performing checks, it’s possible to increase the performance of the entire system. However, having scaling capability is of no use if the query mechanisms are not optimal. We have worked extensively on improving SNMP queries to minimize execution times, thus achieving maximum performance even in environments with high latency.

Road Map

We continue to work on improving data acquisition processes, as well as processing them to create the appropriate output and states for each service. In this regard, we are developing new versions of monitoring packs, for example, to avoid using temporary files in the calculation of traffic statistics processed by network interfaces or Quality of Service classes.

Free edition

Enjoy all the features of Wocu-Monitoring, including support at no cost.

Contact

What to do next?

We want to be your great ally to achieve your corporate challenges.

Ready to witness the digital impact on your business?